Every cement plant operator knows the sound of a healthy kiln drive—and the silence that follows when it fails. A rotary kiln drive gearbox breakdown does not just stop production for hours it can idle an entire line for weeks, trigger emergency procurement at premium prices, and cost a mid-size cement plant anywhere from $500,000 to $2 million in lost output and repairs. Yet most facilities still rely on periodic oil sampling and vibration checks that happen too infrequently to catch the early warning signs of tooth wear, bearing spalling or lubricant degradation before they cascade into catastrophic failure.
This guide breaks down how iFactory AI's predictive analytics engine—combining acoustic emission monitoring, real-time oil parameter analysis, and edge-AI signal processing—continuously watches your main kiln drive gearbox and surfaces actionable alerts days or weeks before a failure event. The result: planned maintenance instead of emergency shutdowns, extended asset life, and a measurable reduction in total maintenance spend.
Reserve a Slot of 30 min - to know why gearboxes fail in rotary kiln drive.
Why Rotary Kiln Drive Gearboxes Fail—and Why It's Hard to Predict
The rotary kiln drive gearbox operates in one of the harshest environments in heavy industry. It runs 24/7, transmitting enormous torque to rotate a cylinder that can weigh thousands of tonnes, at temperatures exceeding 1,400°C inside the kiln. Three failure modes account for the majority of unplanned stoppages:
01
Gear Tooth Wear & Pitting
Progressive surface fatigue causes micropitting that accelerates into full tooth spalling. Early-stage pitting generates ultrasonic stress waves detectable by acoustic emission sensors long before vibration analysis catches anything meaningful.
Primary Detection Signal
Acoustic emission (AE) burst events at 100–400 kHz
02
Lubricant Degradation
Viscosity breakdown, oxidation, and metallic particle contamination destroy the protective oil film between gear faces. A viscosity drop of just 15% from baseline can reduce load-carrying capacity by 30%, accelerating all other failure modes.
Thrust and radial bearings supporting the output shaft develop subsurface fatigue cracks that propagate to surface spalling. Defect frequencies follow predictable mathematical relationships to shaft speed, making pattern recognition highly reliable with AI.
Primary Detection Signal
AE envelope analysis + BPFO/BPFI frequency patterns
The core challenge with traditional maintenance approaches is sampling frequency. A quarterly oil analysis or monthly vibration route misses the 6–14 day window between detectable degradation onset and failure threshold crossing. By the time a lab report arrives, the gearbox may already be operating in its final degradation phase.
6–14
days
Average detection window between onset and failure threshold
$1.2M
avg.
Estimated cost of unplanned kiln drive gearbox failure in a mid-size cement plant
73%
of failures
Could be predicted 7+ days in advance with continuous monitoring
43%
reduction
In unplanned downtime achieved through AI-driven predictive maintenance
The iFactory AI Monitoring Stack: Acoustic Emissions + Oil Intelligence
iFactory AI integrates two complementary sensing modalities into a unified analytics pipeline purpose-built for heavy rotating equipment. Neither modality alone is sufficient—together, they provide overlapping coverage that dramatically reduces false negatives. Book a Demo to learn how iFactory Monitors Acoustic emissions and Oil Intelligence
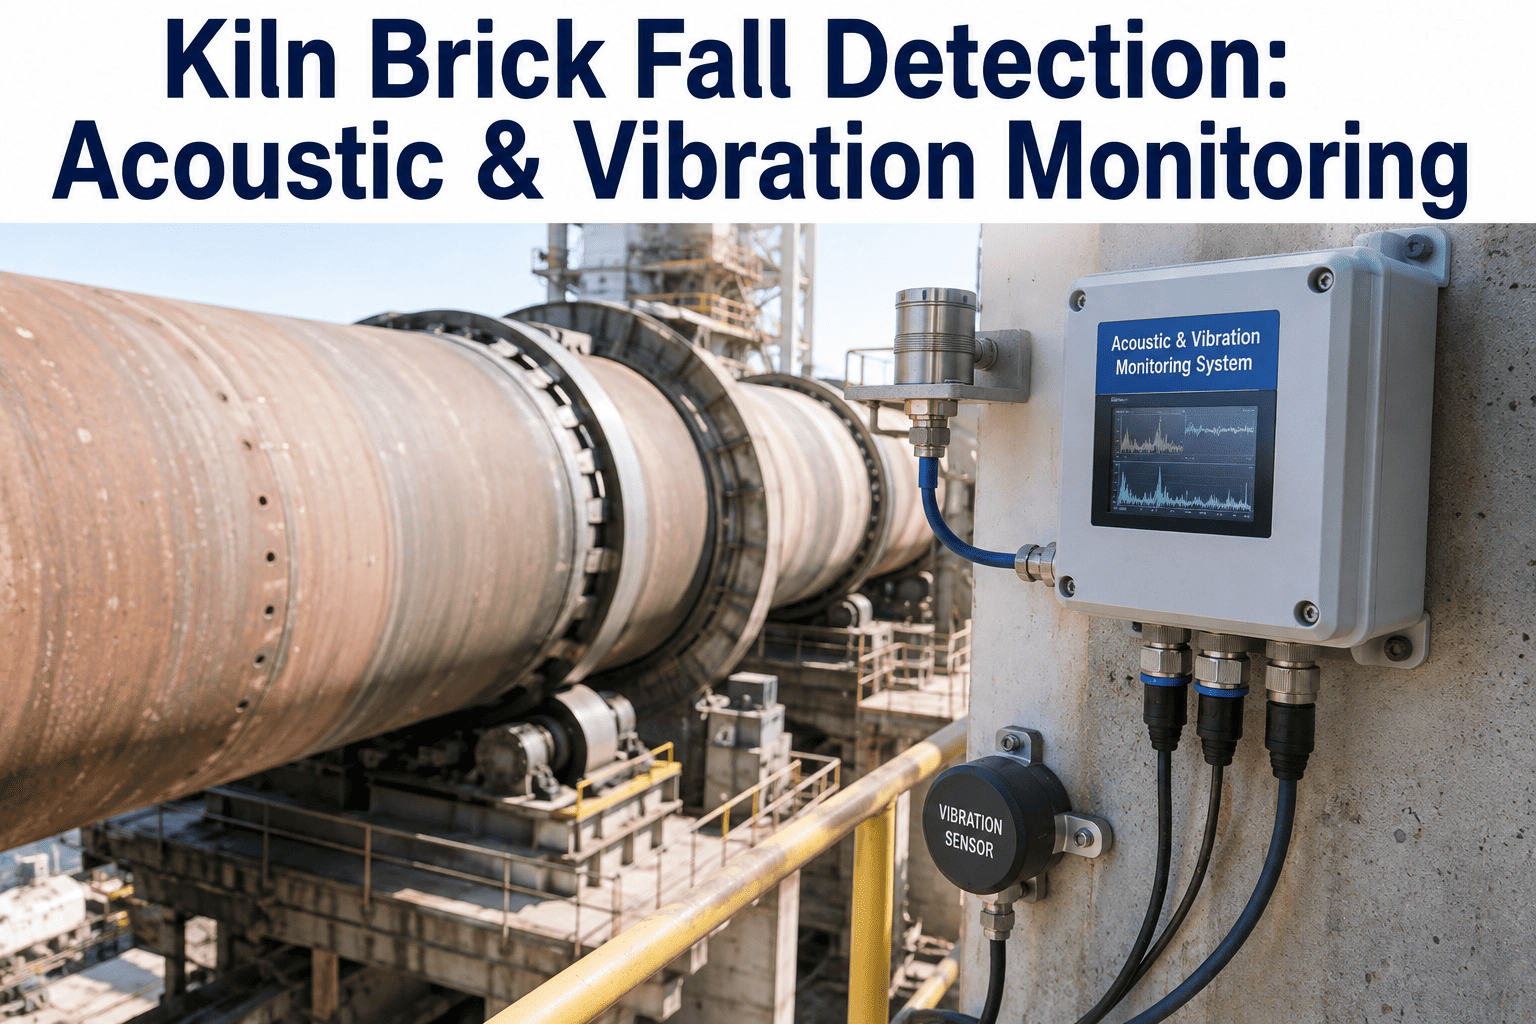
Acoustic emission (AE) sensors mounted directly on the gearbox housing capture stress waves in the 50–500 kHz frequency range—far above the noise floor of conventional vibration analysis. These high-frequency signals travel through the metal structure and are captured before they attenuate, making AE uniquely sensitive to the earliest stages of surface fatigue.
iFactory AI's signal processing pipeline applies adaptive thresholding, kurtosis analysis, and pattern-matched burst detection to distinguish genuine defect events from operational noise sources like gear mesh, lubrication splashing, and thermal expansion. The system learns each gearbox's unique acoustic fingerprint over a 2–4 week baseline period, then flags deviations with configurable severity levels.
AE Parameter
What It Indicates
Threshold Action
Burst Event Rate
Active surface fatigue / crack propagation
Alert at 3× baseline
Peak Amplitude
Severity of individual defect impacts
Alert at 6 dB above baseline
Kurtosis Value
Impulsiveness of defect signal pattern
Alert when K > 4.0
Energy Accumulation
Cumulative defect progression rate
Trend-based predictive alert
Frequency Spectrum Shift
Change in dominant defect mode
Multi-mode diagnostic flag
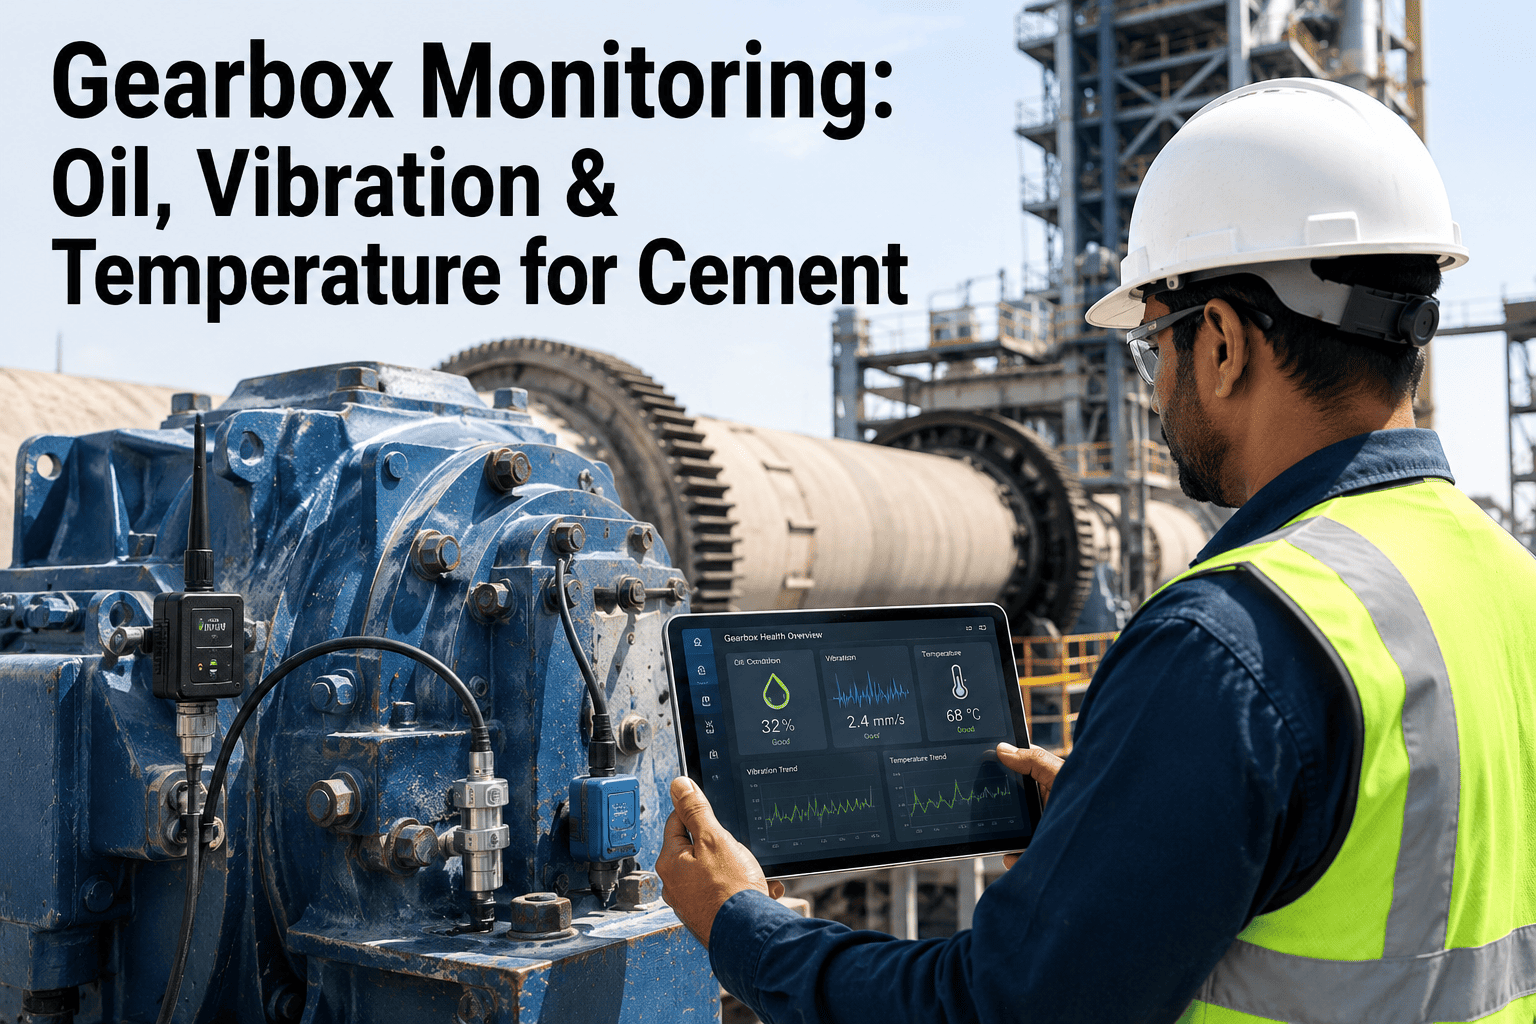
Oil is the lifeblood of any gearbox. iFactory AI integrates with inline oil monitoring sensors that continuously measure viscosity, particle count by size class, water content, oxidation level, and temperature—providing a real-time window into lubricant health without waiting for lab turnaround.
The AI correlates oil parameters with operating conditions (load, speed, temperature) to generate a Lubrication Health Index (LHI) score that accounts for normal operating variation. Anomalies in ferrous particle count are particularly valuable: a rapid rise in particles in the 15–25 micron size class is a strong early indicator of gear tooth or bearing surface fatigue, detectable days before the particle count reaches critical levels.
Oil Parameter
Normal Range
Alert Condition
Kinematic Viscosity (40°C)
Baseline ±10%
>15% deviation from grade spec
Ferrous Particle Count
<500 particles/ml (>4µm)
Rapid rise or >2,000/ml
Water Content
<0.05%
>0.1% (emulsification risk)
Oxidation Level (AN)
<2.0 mg KOH/g above new oil
>3.0 mg KOH/g increase
Oil Temperature
Per OEM spec ±5°C
Persistent exceedance trend
All sensor data is processed locally at the edge before transmission—critical in cement plant environments where network bandwidth is limited and latency cannot be tolerated for time-sensitive fault detection. iFactory AI deploys edge computing nodes rated for industrial environments (IP65, operating to 60°C) that run the full analytics pipeline onsite.
Edge processing enables sampling rates up to 1 MHz for acoustic emission channels, supports real-time alert generation with sub-second latency, and continues operating during cloud connectivity outages. Processed features and alert data are then synchronized to the iFactory cloud platform for fleet-level benchmarking, historical trend analysis, and integration with CMMS work order systems.
Processing Layer
Function
Latency
Edge Node (Onsite)
Raw signal processing, feature extraction, alert generation
<1 second
Plant Gateway
Data aggregation, local historian, CMMS integration
<5 seconds
iFactory Cloud
Fleet analytics, model retraining, reporting, dashboards
Near real-time sync
CMMS Work Order
Automatic work order creation on alert trigger
Configurable (minutes)
How Predictive Analytics Works in Practice
Understanding the end-to-end workflow helps maintenance teams integrate predictive analytics into existing operations without disrupting production rhythms. The iFactory AI approach follows a four-phase process from sensor data to scheduled maintenance action.
1
Continuous Data Acquisition
AE sensors, inline oil monitors, and process data (load, speed, temperature) stream continuously to the edge node. Data is timestamped and correlated with operating mode to ensure anomaly detection accounts for legitimate variation during startups, shutdowns, and load changes.
24/7 — No manual intervention required
2
AI Pattern Recognition & Baseline Comparison
Machine learning models compare current signatures against the established baseline and known failure mode libraries. The system calculates a Health Score (0–100) for each monitored component and tracks rate-of-change—because a rapidly falling score is more urgent than a static low score.
Updated every 60 seconds
3
Alert Triage & Severity Classification
Alerts are classified into three tiers: Advisory (monitor closely, plan inspection within 30 days), Warning (schedule maintenance within 7–14 days), and Critical (immediate action required within 48–72 hours). Each alert includes a plain-language description of the probable failure mode, affected component, and recommended action.
Three-tier severity with automatic escalation
4
CMMS Integration & Planned Maintenance Execution
Warning and Critical alerts automatically generate work orders in your CMMS with pre-populated task lists, required parts, and recommended inspection procedures. Maintenance teams execute planned interventions during scheduled production windows rather than reacting to emergency failures.
Closes the loop from detection to resolution
See How iFactory AI Monitors Your Kiln Drive
Schedule a live demonstration with our heavy industry specialists. We'll walk through a real gearbox health dashboard and show how alerts are generated, triaged, and converted into work orders—with your plant's operating context in mind.
Business Case: Cost of Failure vs. Cost of Prevention
The financial justification for continuous gearbox monitoring is not subtle. The table below uses conservative industry averages for a single-kiln cement plant producing approximately 3,500 tonnes per day of clinker at a net margin contribution of $22 per tonne.
Cost Category
Unplanned Failure Scenario
Predictive Analytics Scenario
Gearbox Repair / Replacement Parts
$180,000 – $450,000
$45,000 – $120,000 (planned, non-emergency)
Emergency Labor & Expediting
$40,000 – $90,000
$8,000 – $18,000 (scheduled labor)
Lost Production (avg. 12-day outage)
$924,000 (3,500T × 12d × $22)
$88,000 (planned 2-day window)
Secondary Damage (downstream equipment)
$50,000 – $200,000
Minimal (intervention before failure)
Expedited Freight & Logistics
$15,000 – $35,000
$0 (parts ordered on standard lead time)
Total Estimated Cost
$1,209,000 – $1,699,000
$141,000 – $226,000
$1M+
Avoided cost per prevented failure event
8–11 mo
Typical ROI payback period for AI monitoring implementation
31%
Average maintenance cost reduction in heavy industry AI deployments
These figures assume a single failure prevention event per year. Most cement plants with continuous monitoring programs report 2–4 significant predictive interventions annually per major drive system—compounding the ROI substantially.
Implementation Roadmap for Cement Plants
Getting predictive analytics operational on your kiln drive does not require a plant shutdown or lengthy systems integration project. iFactory AI's deployment follows a phased approach designed to minimize operational disruption while building monitoring coverage systematically. Schedule a 30 min session for Implementing Roadmap for Cement Plants
Phase 1 — Weeks 1–2
Site Assessment & Sensor Placement
iFactory engineers conduct an on-site assessment to identify optimal AE sensor mounting locations on the gearbox housing, confirm oil monitoring integration points, and map data routing to the edge node location. Sensor installation is completed during a planned 4–8 hour maintenance window—no extended shutdown required.
Gearbox housing AE sensor bonding
Inline oil sensor tap installation
Edge node commissioning & network configuration
Phase 2 — Weeks 3–6
Baseline Learning & Model Training
The AI system operates in observation mode, capturing acoustic fingerprints and oil parameter baselines across the full range of operating conditions: normal run, startup, shutdown, and varying load cycles. iFactory's models are pre-trained on a library of cement kiln gearbox failure signatures, so the baseline period refines rather than starts from scratch.
Normal operating signature capture
Alert threshold calibration to your gearbox
False positive suppression tuning
Phase 3 — Week 7 Onward
Live Monitoring & CMMS Integration
Full predictive analytics go live with real-time dashboards, configured alert routing (SMS, email, CMMS work order), and escalation rules. Integration with your existing CMMS—SAP PM, Maximo, or others—ensures alerts translate directly into actionable maintenance tasks without manual data re-entry.
Live health score dashboards activated
CMMS work order auto-generation configured
Maintenance team training completed
Ongoing
Continuous Improvement & Fleet Expansion
iFactory's reliability team conducts quarterly model reviews, incorporating findings from maintenance interventions to refine detection accuracy. Most customers expand monitoring to additional drive systems—raw mill drives, cooler fans, ID fans—within 12 months of initial kiln drive deployment.
Get a Custom Implementation Plan for Your Facility
Every cement plant is different. Our engineers will assess your specific gearbox configuration, operating profile, and existing maintenance infrastructure to design a monitoring program with realistic timelines and ROI projections—at no cost.
"The combination of acoustic emission monitoring with continuous oil analysis is the most effective approach available today for protecting large rotating machinery like kiln drives. Vibration analysis alone operates too late in the failure progression—acoustic emission catches the earliest micro-crack and surface fatigue events, giving maintenance teams a genuine planning window rather than a crisis response."
— Dr. Mark Aleshin, Principal Reliability Engineer, Heavy Industry AI Applications (2026)
Industry Data Point
A 2025 study of cement plants implementing continuous acoustic emission monitoring on kiln drives reported an average reduction in unplanned gearbox-related downtime of 67% over a 24-month period, with a mean time between failures increase of 2.3× compared to the prior periodic-inspection baseline. Plants using combined AE and oil parameter monitoring outperformed those using either method alone by 28%.
— Global Cement & Heavy Industry Reliability Benchmark, 2025
Conclusion
The rotary kiln drive gearbox is too critical—and too expensive to replace under emergency conditions—to rely on periodic inspection cycles that cannot catch the 6–14 day failure onset window. iFactory AI's continuous acoustic emission and oil parameter monitoring closes this gap, giving cement plant maintenance teams the lead time they need to schedule interventions during planned windows, order parts at standard prices, and prevent the seven-figure cost events that define unplanned kiln stoppages.
The technology is proven, the implementation timeline is measured in weeks rather than months, and the ROI case is straightforward. The question for most cement plant operators is not whether predictive analytics delivers value—it is which assets to instrument first and how quickly to expand coverage across the facility.
Frequently Asked Questions
Can acoustic emission monitoring be installed on a running kiln without a shutdown?
In most cases, yes. AE sensors can be bonded to gearbox housing surfaces during a brief planned maintenance window—typically 4–8 hours—without requiring a full kiln shutdown. Inline oil monitoring sensors require a short isolation of the lubrication circuit, which is usually coordinated with an existing oil change or filter service. iFactory's installation team works with your maintenance scheduler to minimize production impact, and many plants complete sensor installation during a weekend preventive maintenance window.
How does the system distinguish real gearbox defect signals from normal operational noise in a cement plant?
This is the core technical challenge that separates effective from ineffective AE monitoring. iFactory AI addresses it through three layers: (1) frequency-domain filtering that targets the 100–400 kHz range where fatigue events generate energy but most mechanical noise does not; (2) operating-mode conditioning that adjusts thresholds based on current load, speed, and temperature; and (3) a 4–6 week supervised baseline learning period during which the AI establishes your specific gearbox's normal acoustic fingerprint. False positive rates typically fall below 3% after baseline calibration, compared to 15–25% for standard threshold-based vibration monitoring systems.
What is the typical lead time between an iFactory alert and when a gearbox failure would have occurred?
Based on validated field data from heavy industry deployments, iFactory AI issues Advisory-level alerts an average of 21–35 days before projected failure, and Warning-level alerts 7–14 days before failure threshold crossing. Critical alerts—issued when degradation is accelerating rapidly—provide an average of 48–96 hours of lead time. This is sufficient for planned maintenance in the vast majority of cases. The exact window varies by failure mode: gear tooth wear tends to provide longer lead times (weeks) than bearing spalling (days to weeks), which is why multi-modal monitoring is essential.
Does iFactory AI integrate with SAP Plant Maintenance or IBM Maximo?
Yes. iFactory AI supports bidirectional integration with SAP PM, IBM Maximo, Infor EAM, Oracle EAM, and several other enterprise CMMS platforms via standard REST APIs and SOAP interfaces. When an alert triggers a work order, the integration populates the CMMS record with the alert severity, affected asset, probable failure mode, recommended maintenance tasks, and required parts list—eliminating manual data transcription and ensuring maintenance records capture the predictive basis for the work. Integration configuration typically requires 2–3 days of setup during the implementation phase.
What happens to monitoring continuity if the internet connection to the cloud platform is interrupted?
Monitoring and alerting continue uninterrupted during cloud connectivity outages because all real-time analytics run on the local edge node at your facility. The edge node maintains full signal processing, anomaly detection, and alert generation capability independently of cloud connectivity. Alerts are queued locally and routed via configurable on-premises channels (local network notifications, on-premises CMMS integration, local alarm systems). Data collected during an outage is automatically synchronized to the iFactory cloud platform when connectivity is restored, with no gaps in the historical record.