Cement plants run some of the most electrically intensive and thermally stressed industrial equipment in the world — from 5,000V switchgear feeding kiln drives to 1,450C refractory linings containing molten clinker. A single loose electrical connection runs hot enough to ignite a switchgear fire that can shut down the entire plant for weeks, yet this connection was invisible to standard electrical maintenance checks just hours before. Infrared thermography makes these invisible thermal signatures visible, turning a walk-through with a thermal camera into a powerful predictive tool that catches electrical faults, bearing degradation, and refractory failures before they become catastrophic events. Book a demo to see how iFactory integrates thermography data into your maintenance workflow.
Cement Thermal Intelligence
Your Plant Has Hundreds of Hot Spots Right Now. Thermography Finds Them Before They Find You.
Infrared inspections across electrical panels, motor bearings, refractory linings, and process equipment catch failures that vibration analysis, oil analysis, and visual inspection all miss.
Emergency
Imminent Failure
43%
Of plant fires start from electrical faults
3-6 Mo
Lead time from thermal anomaly to failure
96%
Of electrical faults detectable by thermography
Sources: NFPA 70B Electrical Maintenance Standard, Snell Infrared Research, FLIR Industrial Thermography Data
What Thermal Imaging Actually Detects That Other Technologies Miss
Thermography does not replace vibration analysis or oil analysis — it covers a completely different failure mechanism spectrum. Where vibration detects mechanical motion anomalies and oil analysis detects lubricant degradation, thermography detects energy release in the form of heat. This makes it uniquely powerful for electrical systems, refractory condition, and any component where friction, resistance, or insulation breakdown generates abnormal heat.
TH
Thermography
Loose electrical connections
Overloaded circuits and phases
Refractory thinning and hot spots
Bearing lubrication failure
Insulation breakdown in motors
Steam trap failure
Process leakage detection
VB
Vibration Analysis
Bearing wear and spalling
Gear mesh problems
Imbalance and misalignment
Structural resonance
Looseness in mechanical joints
OA
Oil Analysis
Wear metal generation
Contamination ingress
Oil oxidation and degradation
Moisture in lubricant
Additive depletion
Thermography is the ONLY technology that can detect loose electrical connections, overloaded phases, and refractory thinning without physical contact or equipment shutdown.
6 Critical Inspection Zones in Every Cement Plant
A comprehensive thermography program for a cement plant must cover six distinct equipment zones, each with different failure modes, different temperature baselines, and different severity thresholds. Missing any of these zones leaves a blind spot where a failure can develop undetected.
Zone 01
HV/MV Switchgear and MCCs
Baseline: 35-45C
Loose bus bar connections, overloaded breakers, unbalanced phase loading, failing CT/PT connections, arc flash precursors
Highest fire risk in the plant
Zone 02
Kiln and Preheater Refractory
Baseline: 150-350C shell
Refractory thinning, brick fallback, coating loss, hot spots indicating shell exposure, air infiltration points
Kiln shutdown if shell reaches 400C+
Zone 03
Drive Motors and Gearboxes
Baseline: 45-65C housing
Bearing overheating, stator winding hot spots, gearbox oil temperature rise, coupling misalignment heat, fan failure
Motor insulation degrades above 130C
Zone 04
Transformer and Power Distribution
Baseline: 50-70C
Tap changer contact degradation, bushing overheating, overloaded windings, cooling system failure, oil leakage patterns
Transformer failure = plant blackout
Zone 05
Conveyor and Crusher Bearings
Baseline: 35-50C
Failing idler roller bearings, crusher main bearing overheating, seized pulley bearings, conveyor drive overheating
Belt damage from seized rollers
Zone 06
Process Piping and Insulation
Baseline: Varies by process
Insulation degradation on steam lines, refractory loss in ductwork, process fluid leakage, blockage in packed beds
Energy loss and safety hazard
Electrical Panel Thermography: Severity Classification
Not every hot spot demands immediate shutdown. The critical decision is understanding the severity level and the recommended response. The classification system below is based on NFPA 70B and ASTM E1934 standards, adapted for the high-current electrical environments found in cement plants where 400A to 4000A circuits are common and arc flash energy can be catastrophic.
| Severity |
Temp Delta |
Repair Priority |
Failure Risk If Ignored |
Recommended Action |
| Normal |
0 to +5C |
Schedule next survey |
No immediate risk |
Document baseline. Recheck at next interval. |
| Caution |
+5 to +15C |
Plan repair within 30 days |
Slow degradation of connection |
Add to next planned outage work list. Monitor monthly. |
| Warning |
+15 to +30C |
Repair within 7 days |
Rapid oxidation, connection failure likely |
Schedule repair during next shift change or weekend window. Increase monitoring to weekly. |
| Critical |
+30 to +60C |
Repair within 48 hours |
Melting of conductor insulation possible |
Plan immediate load transfer and repair. If load transfer not possible, emergency shutdown required. |
| Emergency |
+60C and above |
Immediate action required |
Arc flash, fire, catastrophic failure |
De-energize immediately if safe. Do not delay. This is an active fire and safety hazard. |
Refractory Thermography: Seeing Through Steel to Protect the Kiln
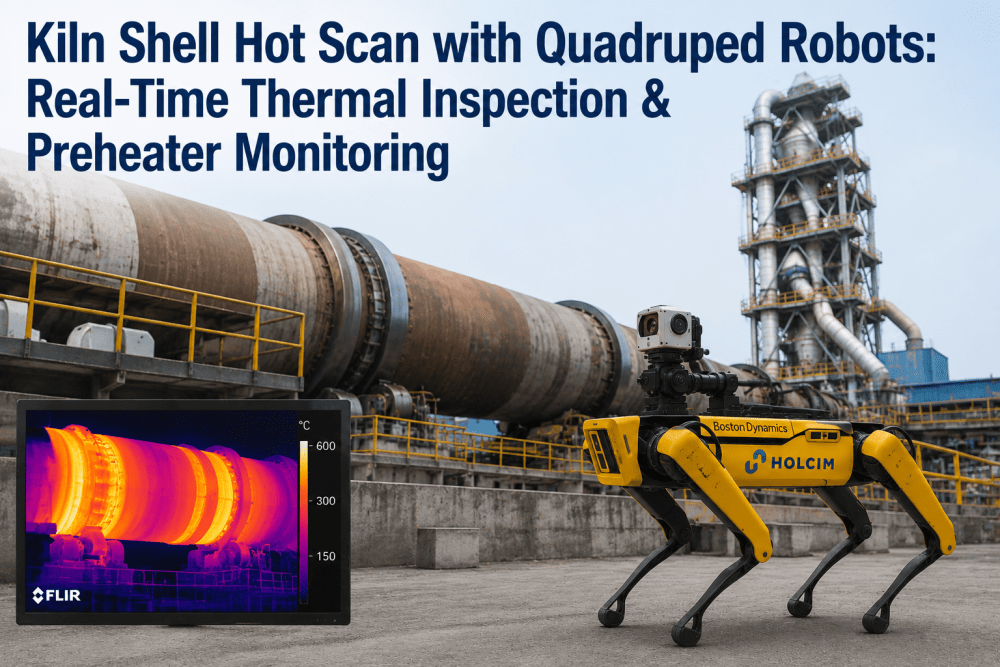
The rotary kiln is the most expensive and longest-lead-time asset in any cement plant. A refractory failure that exposes the steel shell to 1,450C clinker can destroy a $50M kiln section in hours. Thermography is the only non-destructive method that monitors refractory condition while the kiln is running — scanning the shell surface temperature to create a thermal map that reveals exactly where the refractory has thinned, fallen, or lost its protective coating.
Healthy Refractory
Shell temp: 250-320C
Normal operation. Coating intact. No action needed.
Thinning Detected
Shell temp: 350-380C
Warning. Monitor closely. Plan refractory repair at next scheduled stop.
Refractory Failure
Shell temp: 400C+
Critical. Reduce kiln speed immediately. Plan emergency coating repair or shutdown.
$50M+
Cost of kiln shell section replacement
6-8 Wk
Lead time for kiln shutdown repair
72 Hr
From shell hot spot to potential deformation
How Many Hot Spots Are Developing Right Now in Your Switchgear and Kiln Shell?
iFactory integrates thermography data with vibration, oil analysis, and CMMS — creating a single thermal health dashboard that prioritizes repairs by severity and tracks resolution across every inspection zone.
Mechanical Thermography: Bearings, Motors, and Couplings
While vibration analysis remains the primary tool for mechanical condition monitoring, thermography provides complementary detection that vibration alone cannot deliver. Thermal imaging catches overheating caused by lubrication failure, cooling system degradation, and electrical faults in motor windings — failure modes that may not produce significant vibration until damage is already advanced.
High detection capability
Medium detection capability
Low — vibration analysis is primary tool
Inspection Frequency: What Gets Scanned and How Often
Not every component needs the same inspection frequency. Equipment with high failure consequence and rapid failure progression demands more frequent thermal scanning. The matrix below provides recommended inspection intervals based on equipment criticality and the typical speed at which thermal anomalies develop in cement plant environments.
| Equipment |
Frequency |
Load Condition |
Why This Interval |
| HV/MV Switchgear |
Monthly |
Full load preferred |
Loose connections can progress from caution to critical in 4-8 weeks under high current |
| Kiln Shell Refractory |
Continuous / Weekly scan |
Full production |
Coating loss and refractory fallback can expose shell within days. Continuous scanning ideal. |
| Main Drive Motors |
Monthly |
Full load preferred |
Winding insulation degradation is progressive. Monthly trending catches rate of change. |
| Transformer Bushings |
Quarterly |
Full load preferred |
Bushing failures develop over months. Quarterly provides adequate trend data for degradation rate. |
| Conveyor Bearings |
Quarterly |
Normal operation |
Bearing overheating from lubrication failure progresses over weeks. Quarterly catches most cases. |
| Gearbox Housings |
Quarterly |
Normal operation |
Oil temperature trending combined with quarterly thermal scan validates cooling system function. |
| Process Insulation |
Semi-annually |
Normal operation |
Insulation degradation is slow. Semi-annual scans detect energy loss and safety hazards. |
| Steam Traps |
Annually |
Operating |
Steam trap failure rate is predictable. Annual scanning catches blocked and leaking traps. |
From Thermal Image to Work Order: Closing the Loop
The most common failure in thermography programs is not missing a hot spot — it is finding one and failing to act on it. Thermal images stored in folders on a technician laptop do not prevent failures. The value is only realized when thermal findings flow directly into the maintenance workflow with severity-based prioritization, assignment, and tracking to completion.
01
Capture
Thermal scan performed with radiometric camera. Every image includes temperature measurement, location tag, and equipment identifier. No handwritten notes to transcribe later.
02
Classify
AI or analyst classifies each anomaly by severity level using delta-T from baseline. Each finding receives a priority score based on equipment criticality, failure consequence, and thermal severity.
03
Prioritize
All findings ranked against each other and against active work orders from vibration, oil analysis, and operator rounds. The most consequential findings rise to the top regardless of which technology detected them.
04
Resolve and Verify
Work order executed with thermal image attached for the technician. Post-repair thermal scan confirms the fix and closes the loop. Trend data updated to reflect the new baseline.
Frequently Asked Questions
What is the difference between absolute temperature and delta-T in thermography reporting?
Absolute temperature is the measured surface temperature of a component, which varies significantly based on load, ambient conditions, and equipment type. Delta-T is the temperature difference between the suspect component and a similar reference component under the same load conditions. Delta-T is the industry-standard metric for severity classification because it eliminates the influence of ambient temperature and load variations. A connection at 65C in a 25C ambient is far less concerning than a connection at 65C in a 45C ambient — the delta-T tells the real story. NFPA 70B and ASTM E1934 both recommend delta-T as the primary severity indicator for electrical thermography.
Book a demo to see how iFactory automates delta-T calculations.
Can thermography detect refractory problems while the kiln is running?
Yes, this is one of the most valuable applications of thermography in cement plants. Scanning the external kiln shell surface with a thermal camera while the kiln is operating creates a thermal profile that directly maps to the refractory condition inside. Where the refractory is intact and the coating is healthy, the shell temperature typically reads 250-320C. Where refractory has thinned or fallen away, the shell temperature rises to 350-400C or higher, clearly marking the affected zone. Advanced plants use fixed-mount thermal scanners that continuously rotate around the kiln, creating a real-time thermal map that updates every rotation and triggers alerts when any zone exceeds defined temperature thresholds.
What load conditions are required for an effective electrical thermography survey?
Electrical thermography is most effective when equipment is operating at or above 40% of its rated load. Under loaded conditions, the current flowing through a connection generates heat proportional to the square of the current — meaning a loose connection at 25% load produces only 6% of the heat it would generate at full load. Many plants schedule thermal surveys during peak production periods specifically to maximize detection sensitivity. For equipment that cannot be loaded during the survey window, the findings should be flagged as lower confidence and re-inspected under load before making repair prioritization decisions.
Contact our support team for help planning your survey schedule.
How does thermography complement vibration analysis for mechanical equipment?
Thermography and vibration analysis detect different failure mechanisms that often overlap but are not identical. Vibration analysis excels at detecting mechanical motion anomalies like imbalance, misalignment, bearing spalling, and gear mesh problems. Thermography excels at detecting thermal anomalies like lubrication failure, cooling system degradation, electrical winding faults, and overload conditions. A bearing with advanced spalling produces strong vibration but may not be significantly overheated if lubrication is still adequate. Conversely, a bearing with failed lubrication may be severely overheated but show only moderate vibration increase until surface damage begins. Running both technologies on the same equipment provides the most complete condition picture and catches the broadest range of failure modes.
What is the typical ROI of a cement plant thermography program?
A mature thermography program typically delivers 8-15x return on investment annually. The cost of a comprehensive program — including camera equipment, certified thermographer time, and reporting software — runs $40,000-$80,000 per year for a mid-size cement plant. The documented savings come from three primary sources: prevented electrical failures that would cause plant shutdowns worth $100,000-$500,000 per event, extended refractory life through early detection of thinning that avoids $2M-$10M kiln repair projects, and reduced energy costs from identifying insulation degradation and overloaded circuits. Most plants document their first major prevented failure within the first 2-3 surveys, paying for the entire annual program in a single avoided event.
Every Week Without a Thermal Survey Is Another Week of Blind Risk in Your Switchgear
iFactory turns thermal images into actionable work orders — classifying severity by delta-T, prioritizing against all other maintenance findings, and tracking every hot spot from detection to repair verification.