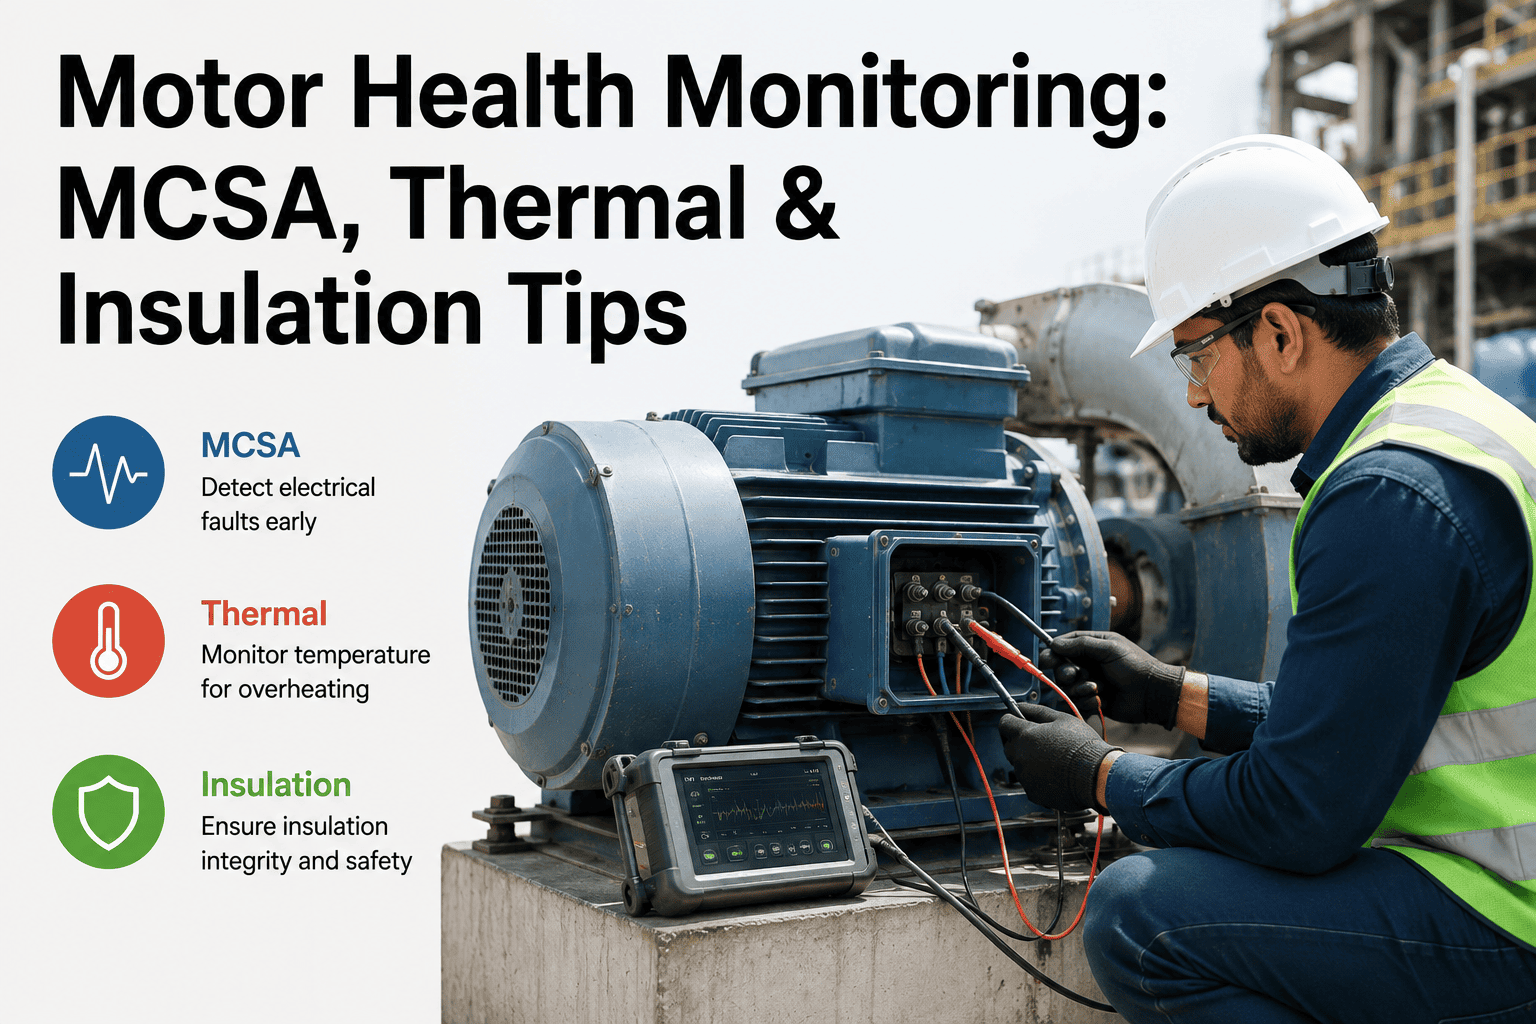
An overheating electrical connection, a motor bearing running hotter than it should, or a process joint losing insulation integrity all give off heat well before they give off a visible or audible warning sign. Thermal imaging turns that invisible heat signature into a picture a technician can read, catching a loose lug or a failing bearing days or weeks before it becomes an electrical fire risk or a motor failure. Most cement plants still run thermography as an annual or semi-annual survey handled by a third-party contractor, which leaves long gaps where a fast-developing hot spot can go completely undetected. Learn how iFactory turns a thermal inspection program into a continuously tracked, plant-wide record with a Book a Demo.
See The Heat Before It Becomes A Trip Or A Fire
Electrical panels, motor bearings, and process equipment all give off early warning heat signatures. iFactory tracks thermal inspection results across every panel, motor, and asset on site, so a rising hot spot gets flagged and scheduled for repair before it turns into an unplanned outage.
Why A Once-A-Year Thermal Survey Leaves Real Gaps
A scheduled annual or semi-annual thermography survey is far better than no inspection at all, but it still leaves most of the calendar year uncovered. The comparison below highlights where that gap creates real risk on a cement plant with dozens of electrical panels and hundreds of motor bearings running continuously.
Detection Timing
An annual survey can only catch a fault that happens to be developing at the moment the technician walks the route, while a loose connection or a bearing starting to overheat between survey dates goes unnoticed until the next scheduled visit or an actual failure.
Record Consistency
Different contractors or technicians on different survey dates can vary in camera settings, distance, and angle, which makes it harder to compare this year's reading against last year's with confidence.
Response Speed
A finding from an annual survey report often sits in a PDF for days or weeks before it becomes a scheduled work order, while a continuously tracked hot spot can be flagged and routed to a technician the same day it crosses a threshold.
The Three Areas Where Thermography Delivers The Most Value
Not every asset on the plant benefits equally from thermal inspection. These three categories consistently produce the earliest and most actionable warnings.
Electrical Panels And Switchgear
Loose lugs, degraded contacts, and overloaded breakers all generate localized heat rise that shows up clearly against the surrounding panel temperature well before insulation damage or an outright trip occurs. Panels carrying high current loads under continuous duty are the highest priority for regular thermal review.
Motor Bearings And Drive Couplings
A bearing losing lubrication or beginning to wear generates friction heat that a thermal camera picks up as a localized temperature rise at the bearing housing, often before the same fault would be obvious through vibration alone, making combined thermal and vibration review particularly effective on critical motors.
Process Equipment And Refractory
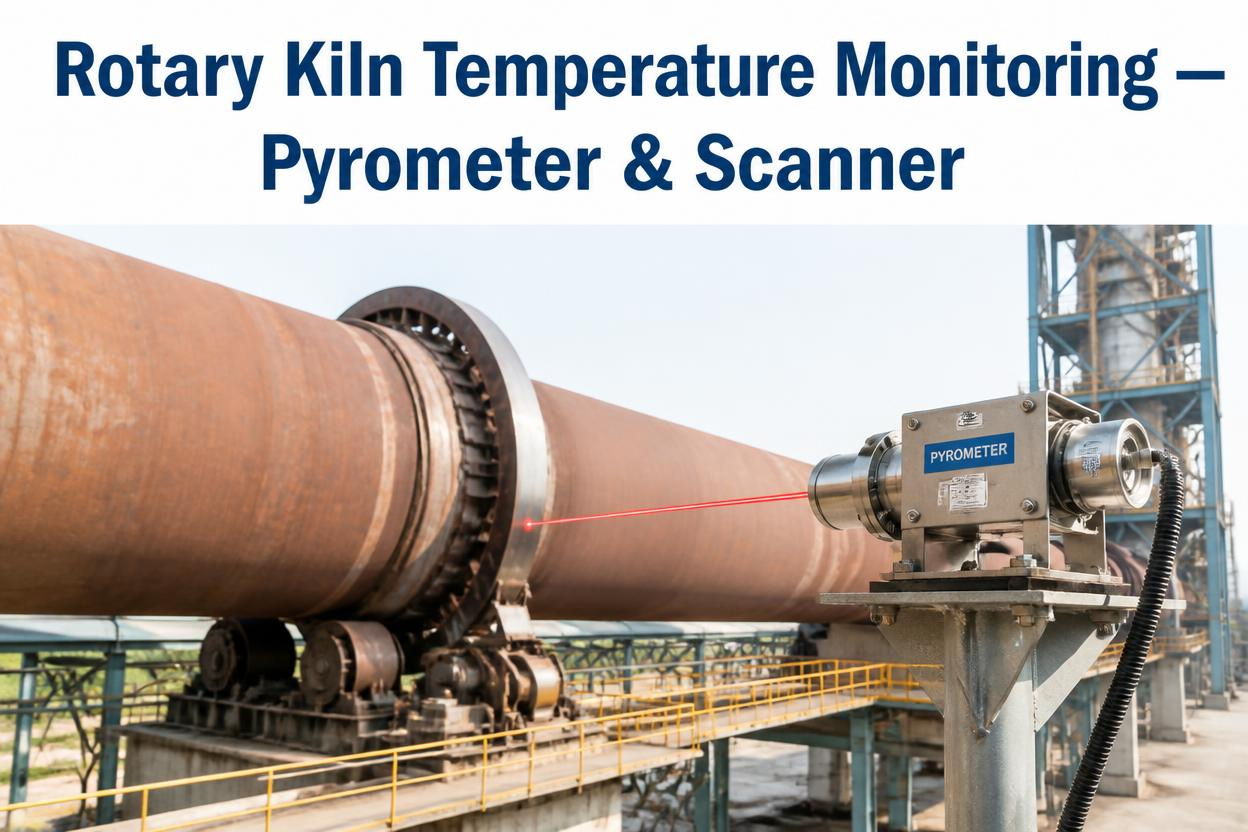
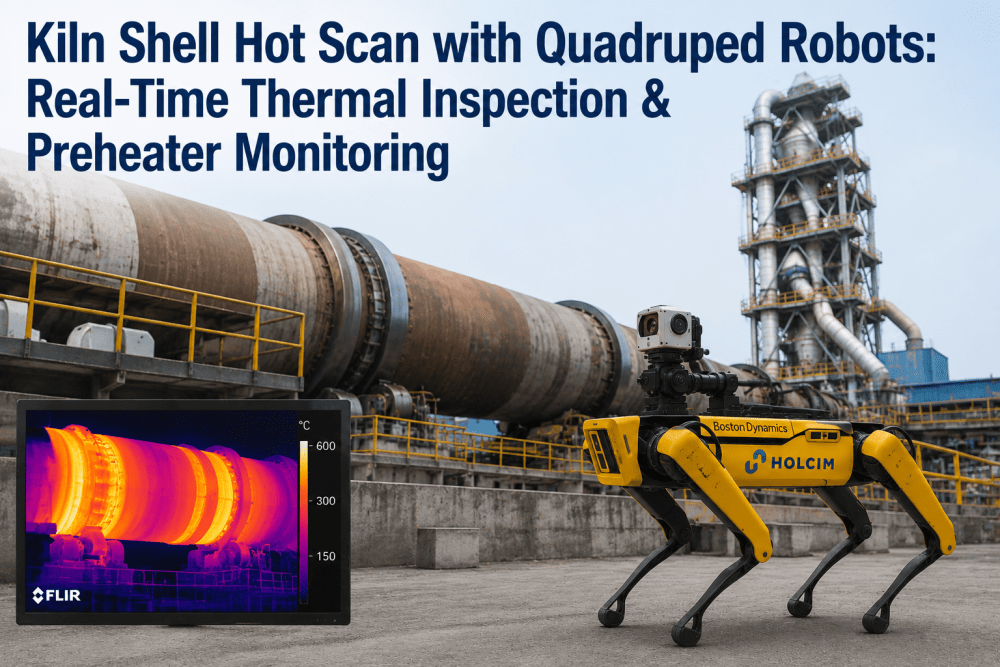
Refractory lining degradation on kilns and preheater ductwork shows up as an external hot spot on the shell where internal insulation has thinned, giving an early indication of lining wear long before a shutdown inspection would otherwise reveal it.
How Electrical Standards Classify Thermal Severity
Thermography findings on electrical equipment are typically classified by the temperature rise above a reference point, such as ambient air or a similarly loaded comparable component, rather than by an absolute temperature alone. The table below reflects commonly used severity classifications for electrical thermal anomalies.
| Temperature Rise Above Reference | Severity Classification | Typical Response Timeline |
|---|---|---|
| 1°C to 10°C | Advisory — monitor | Recheck at next scheduled interval |
| 11°C to 20°C | Minor — plan correction | Schedule repair within weeks |
| 21°C to 40°C | Serious — prioritize repair | Schedule repair within days |
| Above 40°C | Critical — immediate action | Address as soon as safely possible |
These thresholds are general guidance and should be adjusted for the specific equipment type and loading condition, since a rise that is serious on a lightly loaded circuit may be more or less urgent on a heavily loaded one under different ambient conditions.
Where Thermography Programs Miss Findings
A thermal inspection program can look thorough on paper and still miss real faults if a few common issues go unaddressed.
Inspecting Under Light Load Conditions
A loose connection or a developing motor fault may not generate enough heat to register clearly if the equipment is inspected while running well below its typical operating load, which can produce a false sense of confidence in the survey results.
Comparing Across Inconsistent Baselines
Without a consistent reference point and camera distance across inspections, a genuine temperature increase can be masked by measurement variation, or a stable reading can be misread as a new finding.
Findings Not Routed To A Work Order
A survey report that lists findings without automatically generating a corresponding maintenance action often results in flagged items sitting unaddressed until the next survey cycle confirms the same problem has gotten worse.
Skipping Emissivity Adjustment For Different Surfaces
Different surface materials and finishes reflect and emit heat differently, and failing to adjust the camera's emissivity setting for the specific surface being inspected can produce a misleading temperature reading.
Our annual thermography survey used to be a single week where a contractor walked the plant and handed us a report a few weeks later. Twice we found a genuinely dangerous connection that had clearly been building heat for months before the survey caught it. Since we started tracking thermal readings continuously against each panel's own history, we catch the same kind of finding within days instead of waiting up to a year, and it has already prevented at least one breaker failure we could see coming.
One Thermal Record For Every Panel, Motor, And Vessel
iFactory keeps every thermal reading tied to the same asset record over time, so a hot spot trend is easy to compare against last month's reading instead of last year's contractor report.
What Plants Typically See From Continuous Thermal Tracking
Results depend on how many assets are covered and how consistently readings are taken, but the ranges below reflect what cement plants commonly report after moving from an annual survey model to continuously tracked thermal inspection.
What Consistent Thermal Tracking Requires
Moving beyond an annual survey to a continuously tracked program depends less on the camera itself and more on how consistently readings are captured, compared, and acted on.
Standardized Inspection Routes
Defining a fixed route with consistent camera distance, angle, and reference points for each panel or motor makes every subsequent reading directly comparable to the last one.
Load-Aware Scheduling
Scheduling inspections during representative operating load conditions, rather than whenever convenient, ensures a genuine heating fault has the chance to show up clearly in the reading.
Findings Tied Directly To Work Orders
Connecting every finding above an advisory threshold to an automatically generated work order removes the gap between identifying a problem and actually scheduling the fix.
Trend Review Across Inspection Cycles
Reviewing how a specific connection or bearing's temperature has moved across the last several inspections, rather than looking at each reading in isolation, is what actually reveals a slow-developing problem early.
Spot Measurement, Area Measurement, And Isotherm Analysis
The way a thermal image is measured and interpreted affects whether a genuine finding gets flagged or missed, and different measurement tools inside the same thermal camera serve different purposes during an inspection.
Spot Measurement
A single measurement point placed directly on the suspected hot area gives a precise temperature reading at that exact location, but it depends on the technician placing the spot accurately on the true hottest point of the anomaly.
Area Or Box Measurement
Drawing a measurement box around a broader region automatically captures the maximum and minimum temperature within that area, which is more reliable than a single spot when the exact hot point is not obvious at a glance.
Isotherm Analysis
Highlighting all pixels above a defined temperature threshold makes it easier to see the full extent and shape of a hot spot, which helps distinguish a genuine localized fault from a broader area that is simply running warm under normal load.
Pairing Thermography With Electrical Testing And Load Data
A thermal reading is more actionable when it is interpreted alongside other information about the equipment's actual operating condition at the time of inspection, rather than viewed as a standalone number.
Load Data At Time Of Inspection
A temperature rise recorded alongside the actual current or load the circuit was carrying at that moment makes it possible to distinguish a genuine developing fault from a reading that simply reflects an unusually high load period.
Power Quality And Contact Resistance Testing
Following up a flagged thermal finding with a contact resistance or power quality test on the same connection helps confirm the root cause before scheduling a repair, rather than relying on the thermal image alone.
Historical Trend Across Inspection Cycles
Viewing a connection's temperature rise across several past inspections, tied to the load it was carrying each time, gives a much clearer picture of whether the finding represents a stable pattern or a genuinely worsening condition.
Frequently Asked Questions
Q: How often should electrical panels be thermally inspected on a cement plant?
Critical switchgear and panels carrying continuous high current loads generally benefit from quarterly inspection, while lower-criticality panels can often be reviewed on a semi-annual basis. Plants with a history of connection issues or aging electrical infrastructure often shorten these intervals further. The right frequency depends on panel criticality, load history, and how much variability the equipment sees across seasons and production cycles.
Q: Can thermography catch a motor bearing fault before vibration monitoring does?
In some cases yes, particularly for faults related to lubrication loss, where friction heat can rise noticeably before the vibration signature changes enough to trigger an alert. In other cases vibration catches the fault first, especially for faults like imbalance that generate a clear vibration signature without significant heat. Using both together, tied to the same asset record, tends to catch a wider range of developing faults earlier than relying on either method alone.
Q: What causes a thermal reading to be misleading or inaccurate?
Inspecting equipment under light load, using an incorrect emissivity setting for the surface material, inspecting from an inconsistent distance or angle, and reflective surfaces picking up heat from nearby equipment are the most common causes of a misleading reading. Standardizing the inspection route and settings for each asset significantly reduces these sources of error over time.
Q: How does a finding from a thermal inspection turn into a repair?
When a reading crosses a severity threshold for a specific panel or motor, the finding can be routed automatically into a work order with the thermal image, the temperature rise value, and the comparison history attached, giving the electrical or maintenance team the context needed to prioritize and schedule the repair. A Book a Demo session can walk through how that routing works alongside your existing maintenance process.
Q: Is continuous thermal tracking meant to replace scheduled physical inspections?
Continuous tracking is meant to complement rather than fully replace physical inspection, since a technician walking a route can also catch physical issues a thermal reading alone would not reveal, such as visible corrosion or loose hardware that has not yet generated significant heat. Most plants use continuous thermal tracking to prioritize which assets need closer physical attention sooner. Reach out through Support Contact to discuss how this fits alongside your current inspection routine.
Stop Waiting A Year To Find Out About A Hot Connection
iFactory tracks thermal readings continuously against each panel, motor, and vessel's own history, turning a rising hot spot into a scheduled repair before it becomes a trip or a failure.