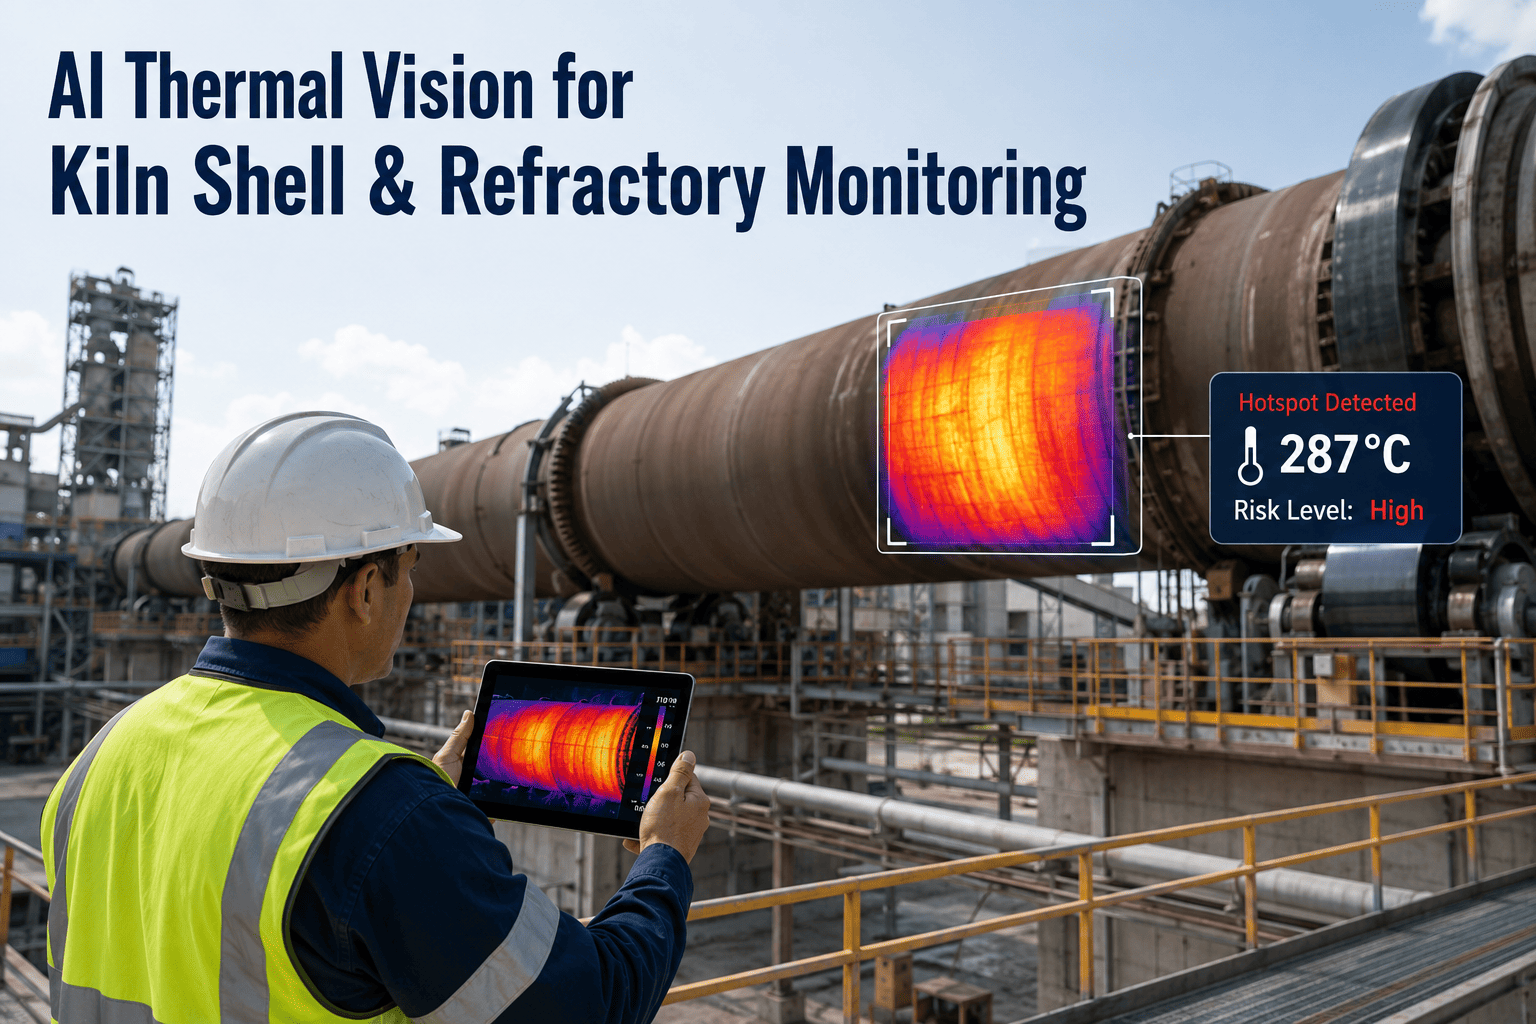
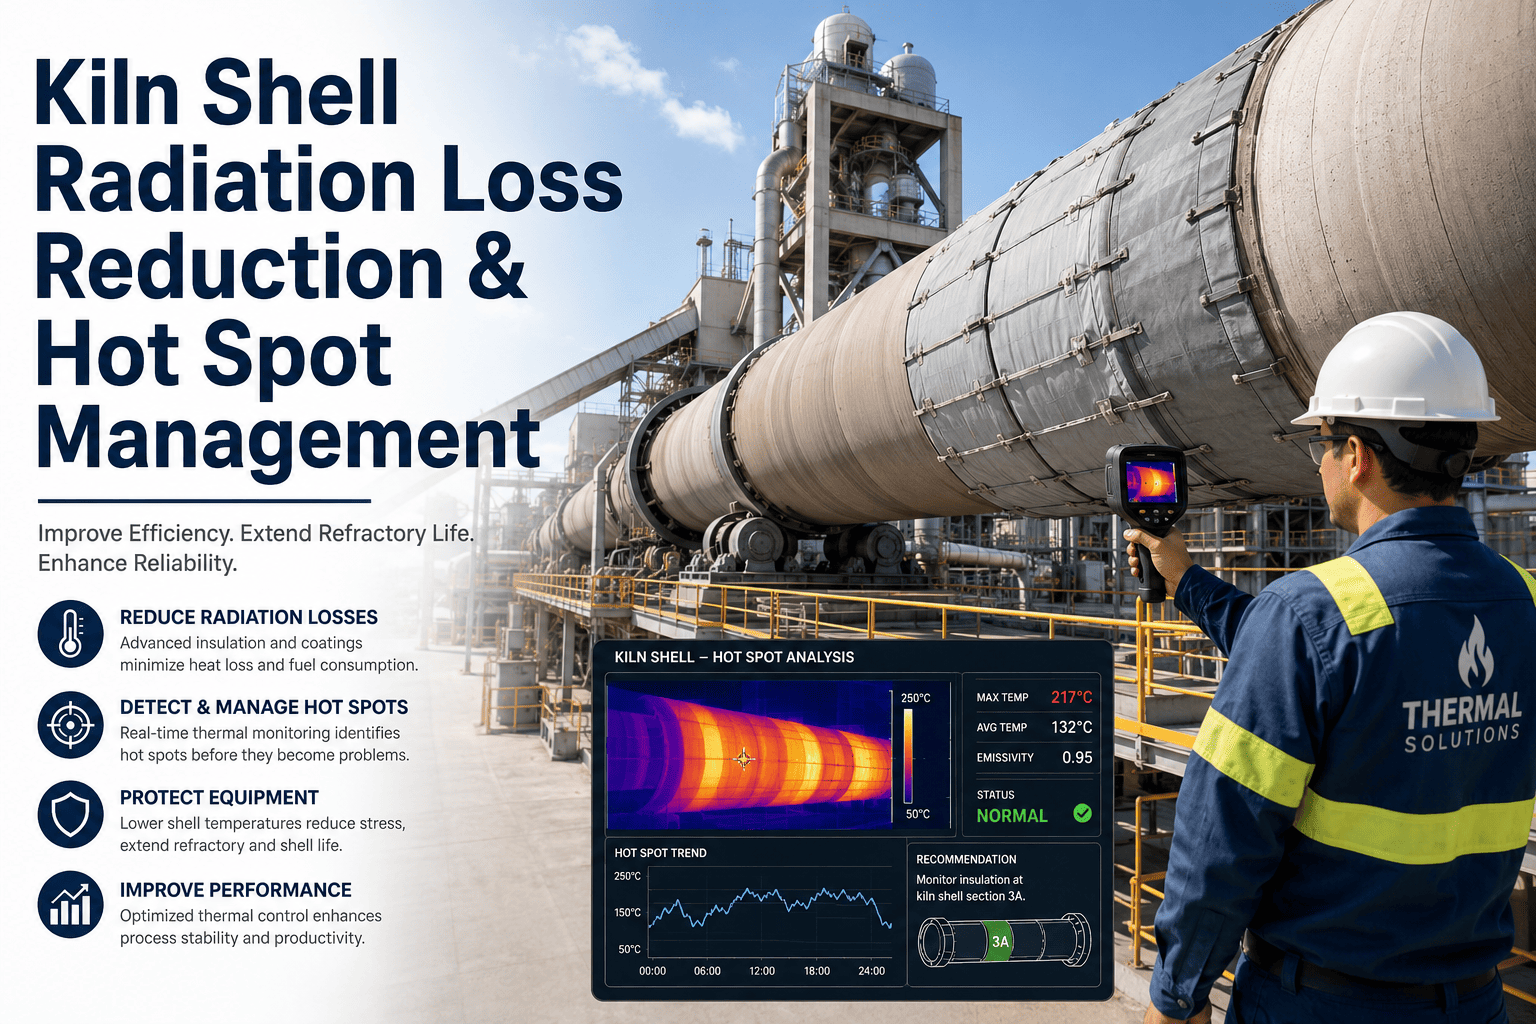
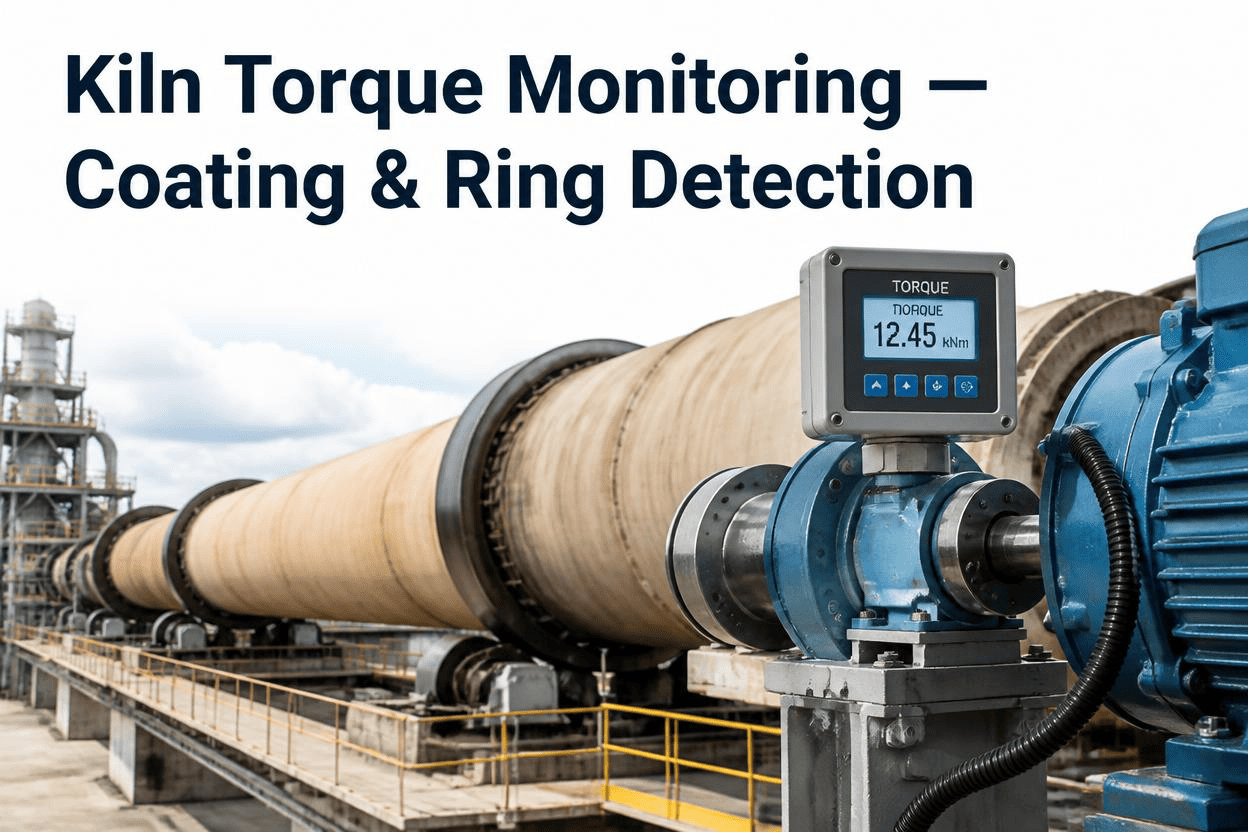
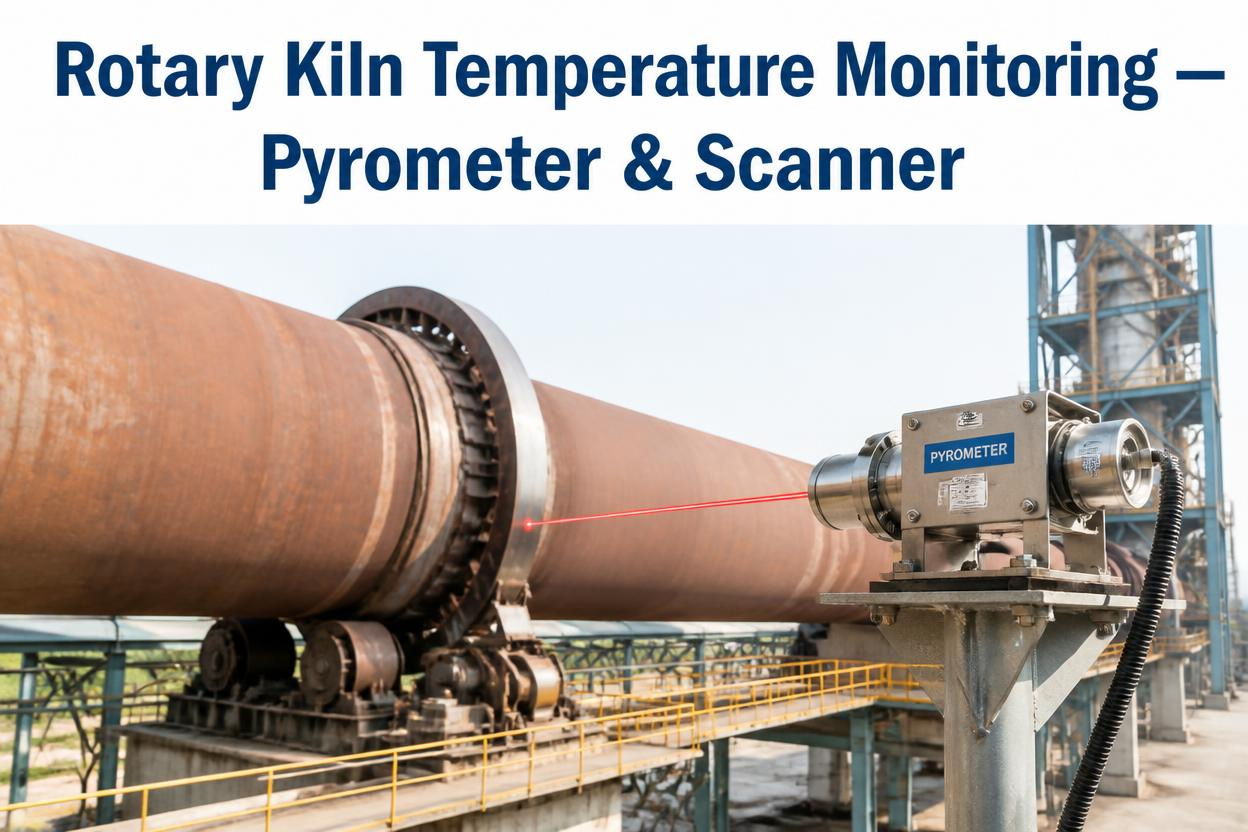
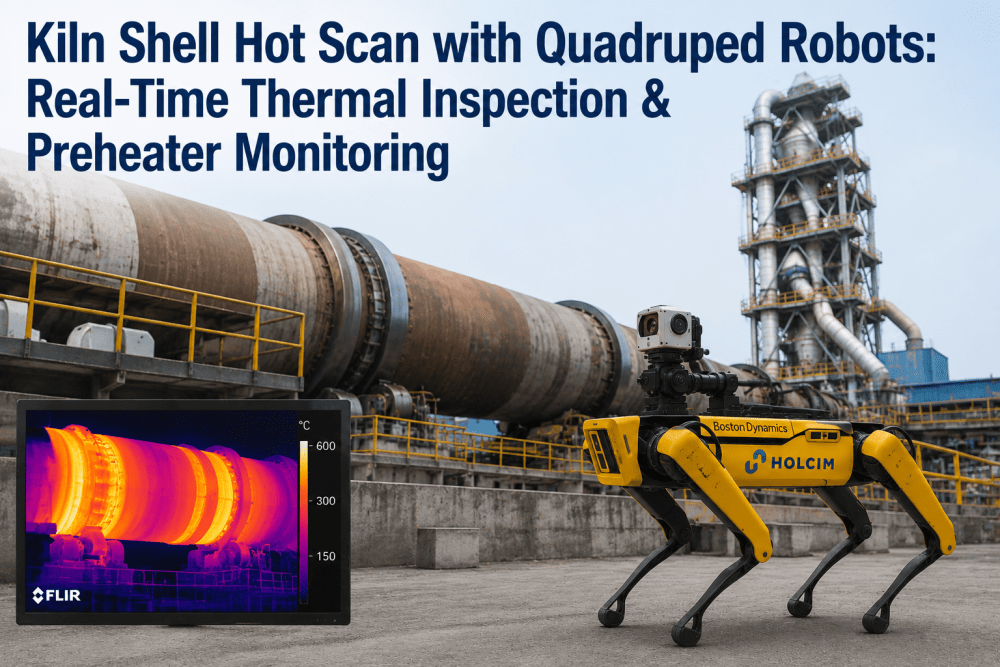
A kiln shell is only ever supposed to be warm to the touch, never visibly hot. The moment a patch of steel starts glowing, the refractory brick behind it has already failed, and the shell itself is losing structural integrity by the hour. What makes shell temperature such a valuable signal is that this failure never happens instantly — coating thins gradually, brick spalls in stages, and the thermal profile shifts measurably weeks before anyone would see a red patch with the naked eye. AI-enhanced thermal imaging for kiln shells exists to catch that gradual shift long before it becomes an emergency.
From First Temperature Drift to Refractory Failure: The Timeline
A red kiln is the last step in a process that starts weeks earlier. Here is what the thermal progression actually looks like, zone by zone, from healthy coating to shell exposure.
Why 400°C Is the Number That Matters
Cement rotary kilns operate with burning zone temperatures around 1,450°C and flame temperatures that can reach 2,000°C, but the shell itself is designed to run far cooler than that — typically kept below roughly 350 to 400°C. Below that threshold, the steel retains its structural properties. Above it, the steel begins to lose strength, and sustained exposure causes permanent deformation that no amount of subsequent cooling will reverse. The refractory lining exists specifically to keep the shell on the safe side of that line, which is why shell temperature is such a direct proxy for refractory condition — a rising shell temperature in a specific zone is, almost by definition, a thinning or failing brick in that zone.
This is also why shell temperature monitoring catches problems that a purely visual inspection cannot. A brick can lose a significant fraction of its thickness while still looking intact from a distance, and the temperature rise that accompanies that thinning is often gradual enough that it wouldn't register as alarming on any single manual infrared gun reading taken during a routine walk-around. Only a continuous, zone-by-zone trend line reveals the trajectory clearly enough to act on with weeks of runway still available.
What AI-Enhanced Thermal Imaging Actually Watches For
Localized Temperature Spikes
A defined hot spot against the surrounding baseline, indicating refractory brick failure or coating detachment at that specific location, typically detected weeks in advance of visible damage.
Gradual Baseline Drift
A slow, steady temperature increase across a zone showing the protective clinker coating thinning over time — the earliest and most subtle signal in the whole progression.
Sudden Temperature Jumps
An abrupt change when a refractory brick cracks, spalls, or falls away entirely, requiring an immediate response rather than scheduled follow-up.
Unexpected Cool Zones
Localized cool spots can indicate excessive material buildup restricting the effective kiln diameter, a blockage risk that a purely hot-spot-focused system would miss.
Tyre Zone Distortion
Temperature-related shell distortion concentrated around tyre locations, an early structural warning distinct from ordinary refractory wear.
Shell-Tyre Movement
Relative movement between the shell and tyre rings during heat-up and cool-down cycles, tracked to prevent the mechanical damage that uncontrolled movement causes over time.
Manual Infrared Checks vs. Continuous AI Thermal Coverage
Case in Point: Catching a Hot Spot Before It Reached the Surface
A plant running continuous AI shell scanning detected a developing hot spot in the burning zone reaching roughly 355°C against a healthy zone baseline well below that — a temperature elevation that was measurable in the thermal data but still well short of anything visible from the ground or concerning on a single spot reading. Rather than waiting for the next scheduled shutdown, the operations team used the early flag to make two immediate adjustments: shifting flame position slightly to reduce localized thermal load on that section of the shell, and scheduling a partial reline of the affected zone during the next planned maintenance window rather than an emergency stop.
The outcome mattered because of what didn't happen — no unplanned shutdown, no red shell, no permanent shell deformation requiring a much larger structural repair. The cost of the intervention was a partial reline during already-scheduled downtime. The cost of the alternative, had the hot spot been allowed to progress to a full brick failure, would have included an unplanned stop, a much larger repair scope, and the risk of permanent shell damage that a partial reline cannot fix. The gap between those two outcomes is entirely a function of how early the signal was caught, and how early it's caught is entirely a function of whether scanning is continuous or periodic.
Mapping Thermal Data to the Refractory Zone Drawing
Raw temperature readings are useful, but their real value comes from being mapped against the kiln's actual refractory zone drawing. A hot spot flagged in isolation tells a reliability engineer that something is wrong; a hot spot flagged and located against a specific zone, brick type, and estimated remaining thickness tells them exactly what to plan for and roughly how much time they have to plan it. This mapping is also what allows remaining refractory life to be calculated from temperature trend history rather than estimated from a generic calendar interval that ignores how that specific zone has actually been wearing.
Every thermal reading is tied to a specific location on the refractory zone drawing, not treated as a generic shell-wide temperature.
Thickness loss rate trended over time produces an estimated remaining brick life for that zone, replacing a guess with a calculation.
Zone-specific data allows a targeted partial reline instead of a full calendar-driven reline that replaces brick still well within its useful life.
Each new campaign's thermal data can be compared against the previous campaign's history for that same zone, revealing whether wear patterns are repeating or changing.
A Hot Spot Doesn't Announce Itself — Continuous Scanning Does
iFactory's AI thermal imaging builds a full shell temperature map every rotation, mapped directly to your refractory zone drawing, so a developing hot spot becomes a scheduled repair instead of an emergency.
Why Coating Loss and Refractory Wear Aren't the Same Problem
It's worth separating two related but distinct causes of rising shell temperature. Clinker coating — a thin protective layer that builds up naturally on the inner refractory surface during normal operation — can thin or shed for reasons unrelated to brick condition, such as a shift in raw meal chemistry, burner flame length, or kiln speed. Refractory brick wear, by contrast, is the gradual physical erosion of the lining itself. Both show up as rising shell temperature, but they call for different responses: a coating issue may resolve with a process adjustment, while a brick wear issue requires a physical reline.
Distinguishing between the two from temperature data alone requires context — how quickly the temperature rose, whether it correlates with a recent process change, and whether the pattern matches prior coating-loss events at that same zone versus a steadier wear trajectory. This is exactly the kind of pattern recognition that benefits from an AI model trained on that specific kiln's history rather than a fixed threshold applied uniformly across every zone and every kiln.
Building Thermal Review Into the Maintenance Calendar
Continuous scanning only delivers its full value when the data is actually reviewed on a regular cadence rather than left to accumulate until a shutdown planning meeting. A short daily glance at any new zone deviation, a weekly ranking of which zones are trending fastest toward their alert threshold, and a monthly comparison against the campaign's historical wear curve together turn a stream of thermal readings into a genuinely proactive refractory management program rather than a passive data log that only gets consulted after something has already gone wrong.
How Thermal Scanning Hardware Actually Works on a Rotating Kiln
Scanning a continuously rotating cylinder that reaches shell temperatures well above ambient is a different engineering problem than scanning a stationary asset. Fixed-position infrared scanners are typically mounted along the length of the kiln at intervals corresponding to each major refractory zone, each one capturing a full circumferential temperature profile on every single rotation as the shell passes beneath it. The scanning frequency this produces — potentially dozens of complete circumferential readings per hour depending on kiln rotation speed — is what makes continuous coverage meaningfully different from a periodic manual check, which might only capture a handful of readings across an entire shift.
The raw thermal data from each scan point is then stitched together into a continuous shell temperature map, updated in near real time and compared automatically against a historical baseline specific to that zone. This baseline comparison matters because a kiln's normal operating temperature varies meaningfully by zone — the burning zone runs hotter than the preheating zone by design, and a fixed threshold applied uniformly across the whole shell would either miss real problems in cooler zones or generate constant false alarms in the naturally hotter ones. An AI model trained on zone-specific historical data avoids both failure modes by learning what normal actually looks like at each individual point along the shell.
What Happens After an Alert Fires
Detection is only useful if it leads somewhere. When a zone's temperature trend crosses its alert threshold, the goal is for that alert to arrive already carrying the context a reliability engineer needs to make a decision — which zone, what the current estimated remaining brick thickness is, how fast the trend is moving, and what the recommended response window looks like given the next scheduled shutdown. An alert that simply says a threshold was crossed, without that surrounding context, still leaves someone to do the investigative work manually, which erodes much of the time advantage the early detection was supposed to provide in the first place.
Immediate Notification
The responsible reliability engineer or maintenance planner is notified as soon as a zone crosses its alert threshold, with the specific zone and trend rate included.
Recommended Response Window
Based on the current trend rate, an estimated window is provided for when intervention becomes necessary, allowing the repair to be matched against the next available planned stop.
Work Order Generation
A structured work order can be generated directly from the alert, closing the gap between detection and a documented, assigned corrective action.
Building the Business Case Beyond Downtime Avoidance
Downtime avoidance is usually the headline justification for a thermal monitoring investment, but it isn't the only line item worth including in the business case. Energy efficiency is a quieter but consistent secondary benefit: a shell losing heat through a thinning refractory zone is wasting fuel even before that zone reaches a failure threshold, since the kiln's control system has to compensate for that heat loss to maintain the burning zone temperature the process actually requires. Catching coating and refractory degradation early doesn't just prevent a future shutdown — it also recovers a portion of that ongoing energy loss during every month the condition goes uncorrected.
There's also a capital planning benefit that's easy to overlook until a plant has lived with condition-based reline data for a full campaign or two. Fixed calendar reline intervals are typically set conservatively, which means brick that still has meaningful remaining life often gets replaced anyway simply because the calendar said it was time. Zone-level thermal history removes the guesswork, allowing a reline scope to be built around brick that has actually reached the end of its useful life rather than brick that merely happens to fall inside a scheduled window. Over several campaigns, this shifts refractory spending from a fixed recurring cost to a genuinely optimized one.
Getting a Baseline Without Waiting for a Full Reline Cycle
A common hesitation before starting continuous thermal monitoring is the assumption that meaningful insight requires waiting through a full refractory campaign to build up enough history. In practice, useful value starts much sooner. Even a few weeks of continuous scanning establishes a reliable zone-by-zone baseline, since the shell's normal operating pattern under steady production is generally consistent well before any degradation begins. From that baseline, the first genuinely useful signal — a zone beginning to drift above its established normal range — can be caught within the first full production cycle after deployment, long before a complete campaign's worth of history has accumulated.
The value compounds from there. Each subsequent campaign adds to the historical record for that specific kiln, refining the model's understanding of what a normal wear trajectory looks like at each zone and improving the accuracy of remaining-life estimates over time. A plant doesn't need to wait for perfect data to start benefiting — the earliest gains come simply from replacing periodic manual spot checks with continuous coverage, and the model's precision improves steadily as more campaign history accumulates behind it. Plants starting from zero historical thermal data typically see the system reach a stable, reliable baseline well within a single production quarter, at which point the alerting becomes as trustworthy as it will ever get short of multiple full campaigns of accumulated history.
Frequently Asked Questions
At what shell temperature does permanent damage actually begin?
Kiln shells are designed to run well below roughly 350 to 400°C. Below that range the steel retains its structural properties, but beyond it the steel begins to lose strength, and sustained exposure causes permanent deformation that cannot be reversed by subsequent cooling. This is why shell temperature is tracked as a leading indicator rather than waited on as a pass or fail alarm. Visit support to see how zone-specific alert thresholds are configured below that danger point.
How early can AI thermal imaging detect a developing hot spot?
Continuous AI-based thermal trending commonly detects a developing hot spot 30 or more days before it would become visible as a red shell, since the underlying coating and brick thinning process is gradual and produces a measurable temperature rise well before any visual sign appears. Book a demo to see actual lead-time examples from kilns similar to yours.
Is a rising shell temperature always a refractory brick problem?
Not always. Rising shell temperature can also result from clinker coating loss caused by a shift in raw meal chemistry, flame length, or kiln speed rather than physical brick wear. Distinguishing between the two requires context from the temperature trend pattern and recent process history, which is part of why continuous, zone-mapped data matters more than a single spot reading.
Can thermal imaging replace manual infrared inspections entirely?
Continuous AI scanning covers the gap that periodic manual checks inherently leave — the days between inspection rounds when a hot spot can form and go unnoticed. Most plants use continuous scanning as the primary detection method while retaining periodic manual checks as a secondary verification step, particularly during planned shutdowns when the shell can be inspected directly. Contact support to see how the two methods complement each other in practice.
How does zone-mapped thermal data change refractory reline planning?
Instead of relining the full kiln on a fixed calendar interval regardless of actual condition, zone-mapped temperature trending allows remaining brick life to be estimated per zone, so a reline can be scoped to only the sections that actually need it. This condition-based approach commonly extends overall campaign life while still preserving enough lead time to procure brick and plan the shutdown properly.
See Your Kiln's Thermal Profile Live, Not at the Next Shutdown
iFactory turns continuous shell scanning into a zone-mapped, trended thermal record — so refractory decisions are based on measured condition, not a fixed calendar guess.