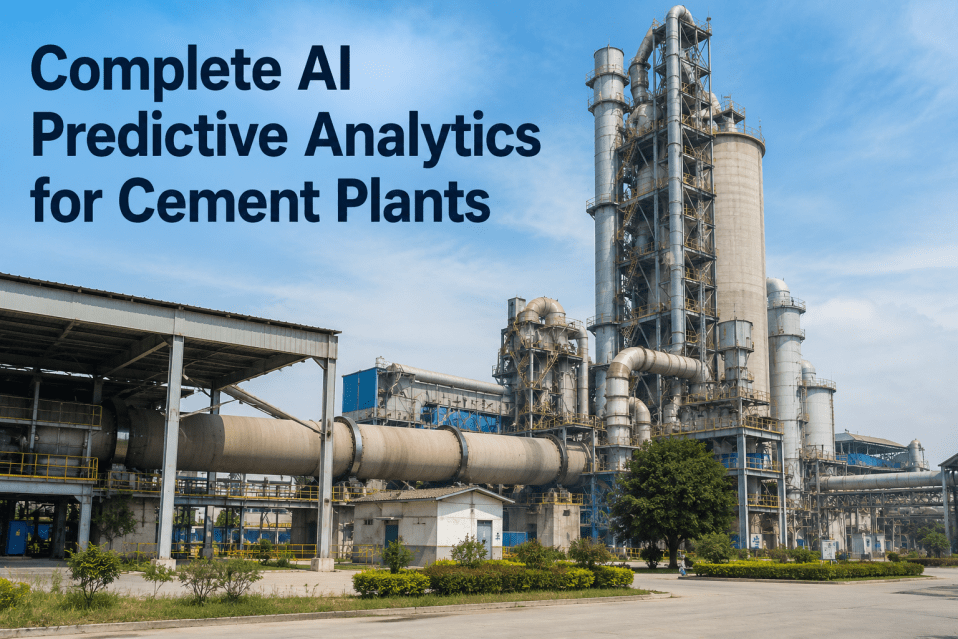
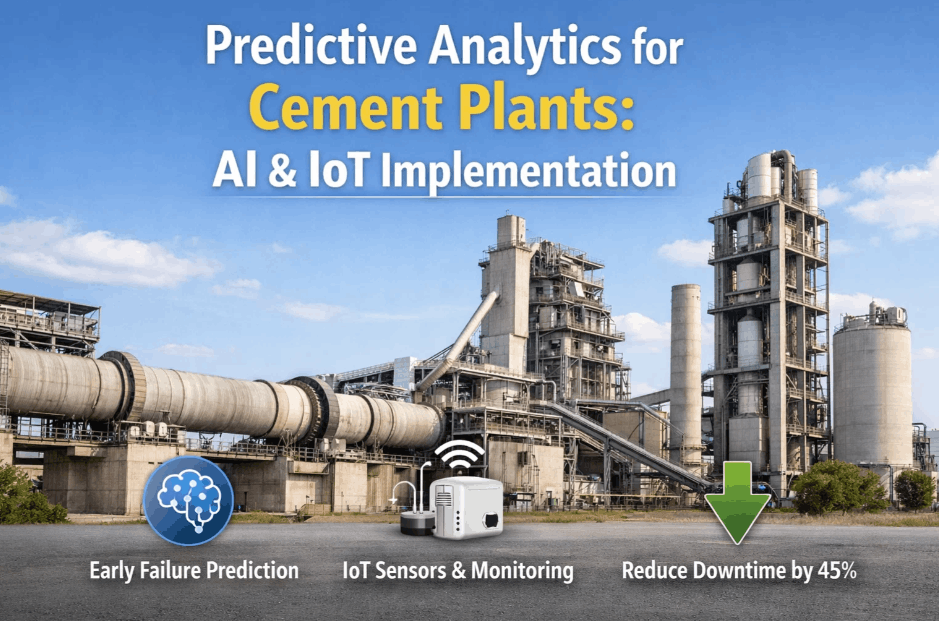
Cement plants generate more SCADA data in a single shift than most teams can review in a week, yet the overwhelming majority of that data is only ever looked at after something has already gone wrong. Traditional alarm systems are designed to react when a single sensor crosses a fixed threshold, which means they are structurally incapable of detecting the slow, multi-variable drift patterns that precede most equipment failures in cement operations. The gap between what your SCADA system records and what it actually catches is where AI anomaly detection creates its value, and you can see how iFactory applies this to real cement plant data by choosing to book a demo with our team.
PREDICTIVE MAINTENANCE · AI SCADA ANALYTICS · CEMENT OPERATIONS
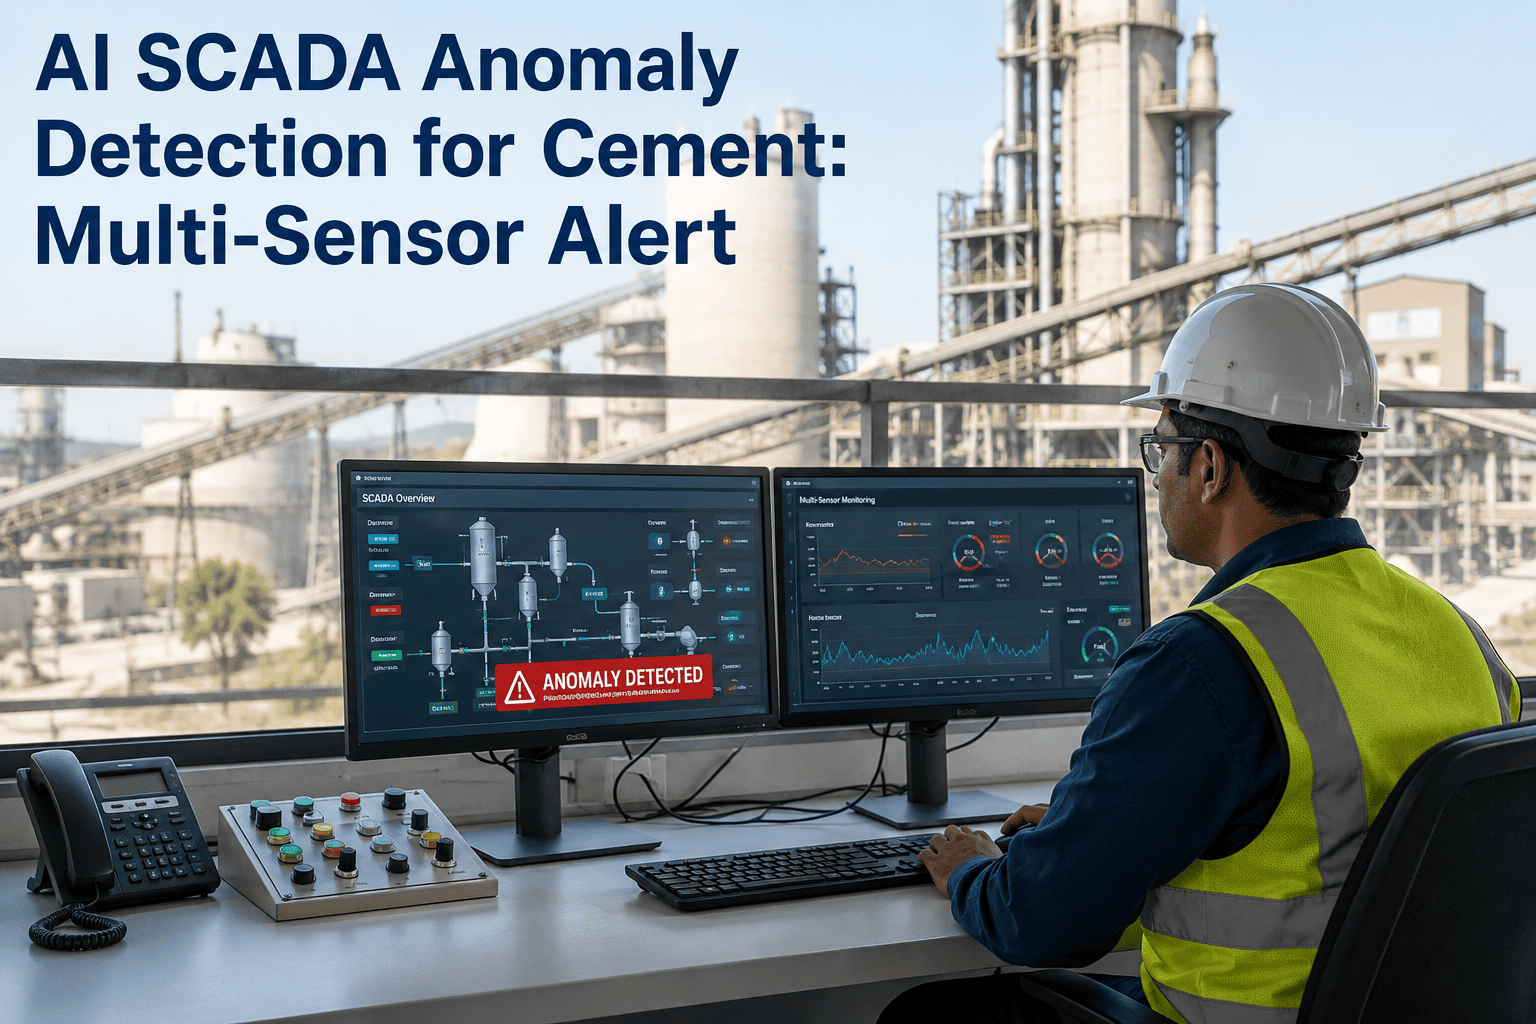
AI SCADA Anomaly Detection for Cement: Why Single-Sensor Alarms Keep Missing the Real Problems
iFactory's AI layer sits on top of your existing SCADA infrastructure, correlates patterns across hundreds of sensor tags simultaneously, and alerts your team to degradation weeks before a threshold alarm would ever fire.
WHAT TRADITIONAL SCADA ALARMS CONSISTENTLY MISS IN CEMENT PLANTS
Slow bearing degradation across vibration + temperature
Kiln shell distortion patterns in temperature profile
Raw mill vibration correlated with material hardness shift
Cement mill overload building across power + feed rate
THE DATA PROBLEM IN CEMENT
Your SCADA System Records Everything but Detects Almost Nothing Until It Is Too Late
A mid-size cement plant typically runs between two thousand and five thousand SCADA tags at any given time, covering everything from kiln shell temperatures and roller press hydraulic pressures to bag filter differential pressures and cooler fan currents. That data is logged faithfully every few seconds, archived in historians, and displayed on operator screens in real time. The problem is not that the data is missing. The problem is that no human operator can mentally correlate even fifty of those tags simultaneously to spot a pattern forming across multiple variables, and traditional SCADA alarm systems were never designed to attempt that correlation in the first place.
The result is a paradox that every cement plant lives with: enormous data richness paired with extremely shallow analysis. Alarms fire when a single temperature exceeds a fixed setpoint or when a vibration reading crosses a hardcoded limit, but the slow, interacting drift across multiple related variables that constitutes the actual early warning sign of most mechanical and process degradation passes completely unnoticed. By the time any single sensor is far enough out of range to trigger an alarm, the underlying problem has typically been developing for days or weeks, and the maintenance window that could have prevented a breakdown has already closed.
2,000-5,000
SCADA tags generating data continuously in a mid-size cement plant
Less than 2%
Of logged SCADA data is ever analyzed for patterns beyond single-point threshold checks
70-80%
Of unplanned cement equipment failures show detectable multi-sensor drift in the weeks before the event
MULTI-SENSOR FUSION
Why Anomaly Detection in Cement Requires Correlating Sensors, Not Just Monitoring Them
The fundamental limitation of traditional SCADA alarm systems is architectural, not fixable with better tuning or more alarm rationalization. A threshold alarm evaluates one tag against one limit at one moment in time. It has no concept of how that tag relates to any other tag, no memory of what the baseline pattern looked like yesterday or last week, and no ability to recognize that a combination of small, individually normal readings across five different sensors actually represents a significant departure from the normal operating pattern for that piece of equipment. Multi-sensor fusion is the practice of feeding all relevant sensor streams into a single analytical model that learns the correlated behavior patterns and flags deviations from those patterns as potential anomalies.
In a cement plant, this matters because equipment does not fail on a single dimension. A kiln roller bearing does not just vibrate more, it vibrates more while running slightly warmer than usual while drawing marginally more current than the adjacent roller under the same load conditions. Each of those readings alone might sit comfortably within its alarm threshold. Together, they form a pattern that an experienced engineer might intuitively recognize as wrong, but that same engineer is monitoring dozens of screens and cannot perform that correlation for every piece of critical equipment simultaneously. AI anomaly detection performs that correlation continuously, for every tagged asset, without missing a shift or getting distracted by an alarm flood on a different screen.
Vibration Sensors
Bearing health, imbalance detection, structural resonance, gearbox condition on mills and fans
Temperature Sensors
Kiln shell profiles, bearing temperatures, motor winding temps, gas outlet temperatures
Motor Current / Power
Mill load indication, fan curve deviation, compressor performance, conveyor overload trends
Pressure Transmitters
Hydraulic system pressure, bag filter DP, kiln hood pressure, cooler chamber pressures
Flow Meters
Cooling water flow, lubrication oil circulation, fuel flow rates, combustion air volumes
Gas Analyzers
O2, CO, NOx levels in preheater exit and kiln inlet for process anomaly correlation
HOW AI ANOMALY DETECTION WORKS
From Raw SCADA Tags to Actionable Alerts: The Five-Stage Detection Pipeline
AI anomaly detection for cement SCADA data is not a single algorithm or a black box that magically produces answers. It is a structured pipeline where raw data moves through distinct stages, each adding a layer of analysis that brings the data closer to something a maintenance planner or reliability engineer can act on. Understanding this pipeline matters because it is the exact structure you should ask any vendor to demonstrate when evaluating AI-based monitoring solutions, and it is the structure that separates a product that genuinely understands cement operations from one that has repackaged a generic industrial analytics toolkit with a cement slide deck.
The pipeline below represents how iFactory processes SCADA data from cement plants. Each stage has a specific input, a specific processing step, and a specific output that feeds the next stage. Skipping a stage, such as going straight from raw data to alerting without the pattern learning and baseline establishment phases, is the most common reason AI detection projects produce either too many false positives that train operators to ignore them or too few detections that miss the anomalies they were supposed to catch.
01
Data Ingestion and Cleaning
Raw SCADA data arrives at different scan rates, with different timestamps, and with gaps caused by sensor failures or communication dropouts. This stage normalizes time alignment, fills or flags gaps, removes obvious sensor faults, and resamples all relevant tags to a consistent interval so the downstream model receives clean, synchronized input rather than the messy reality of live plant data.
02
Baseline Pattern Learning
The AI model ingests weeks or months of historical data for each monitored asset to learn what normal looks like for that specific piece of equipment under its actual operating conditions. This is not a generic normal, it is a learned baseline that accounts for production rate changes, seasonal temperature variations, and the unique wear signature of that particular kiln, mill, or fan in your plant.
03
Real-Time Deviation Scoring
As new data flows in, the model continuously compares the current multi-sensor pattern against the learned baseline and produces a deviation score that quantifies how far the current operating state has shifted from normal. This score updates continuously, not at discrete alarm check intervals, which means it captures gradual drift that threshold-based systems cannot see.
04
Anomaly Classification
Not every deviation is a problem. The model distinguishes between known operational mode changes such as a planned production rate adjustment or a fuel switch, and genuine anomalies that do not correspond to any recognized operating pattern. This classification step is what prevents the alert flood that kills operator trust in AI monitoring systems.
05
Alert Generation with Context
When a classified anomaly is confirmed, the system generates an alert that includes not just the fact that something is wrong but which sensors are contributing most to the deviation, how the pattern compares to known failure modes, and a suggested investigation path. This context is what turns a raw anomaly score into something a maintenance planner can act on without spending hours tracing the data manually.
See the Five-Stage Pipeline Applied to Your Plant's Actual SCADA Data in a Live Session
iFactory connects to your existing SCADA historian, runs the pipeline against your real equipment data, and shows you exactly what anomalies it finds that your current alarms are missing.
TRADITIONAL VS AI DETECTION
Side-by-Side: What Changes When You Add AI Correlation on Top of Existing SCADA Alarms
The table below is not theoretical. It reflects the actual operational differences that cement plants report after deploying AI anomaly detection alongside their existing SCADA alarm infrastructure. The key insight is that AI detection does not replace your existing alarms, it adds a parallel detection layer that catches the problems your alarms are architecturally incapable of catching. Plants that try to replace threshold alarms entirely with AI detection usually regret it, because threshold alarms remain the fastest and most reliable way to catch sudden, single-point failures like a sensor wire break or a sudden pressure spike. The value of AI is in the slow, multi-variable failures that threshold alarms never see coming.
ALERT SEVERITY AND ESCALATION
Not Every Anomaly Deserves the Same Response: A Three-Tier Alert Structure That Operators Actually Follow
One of the fastest ways to destroy operator trust in an AI monitoring system is to send every detected anomaly to the same notification channel with the same urgency level. Operators who receive a critical-looking alert for a minor deviation and a similar-looking alert for a genuine equipment threat will quickly learn to ignore both. The alert structure below is designed to match the response urgency to the actual risk level so that operators know exactly what each alert expects them to do when it arrives. The structure works because it is predictable, consistent, and tied to concrete actions rather than abstract risk scores.
Deviation score is elevated but below the critical threshold. The pattern is unusual but not yet clearly trending toward failure. No immediate action required, but the anomaly is logged and visible on the monitoring dashboard for the shift supervisor to review during routine checks.
Action: Log and monitor. Review trend during next shift handover if score continues rising.
Deviation score has crossed the warning threshold and the pattern has persisted across multiple detection cycles, confirming it is not a transient spike. The correlated sensor data suggests a specific degradation pathway that matches a known failure mode for this equipment type.
Action: Notify maintenance planner. Schedule inspection within the next planned maintenance window or within 48 hours if no window exists.
Deviation score has reached the critical threshold and the anomaly pattern is accelerating. The multi-sensor correlation indicates that the underlying degradation is progressing toward a failure state that will result in unplanned downtime if not addressed. The alert includes the specific sensors driving the score and a prioritized investigation checklist.
Action: Immediate notification to maintenance manager and shift supervisor. Investigation within current shift. Plan for controlled shutdown if investigation confirms the finding.
CEMENT-SPECIFIC DETECTION SCENARIOS
Five Equipment Failures That AI Catches Weeks Before a SCADA Alarm Would Fire
The scenarios below represent the most commonly cited early detection wins from cement plants that have deployed AI anomaly detection on their SCADA data. Each one involves a failure mode that is well understood in principle but extremely difficult to catch with traditional single-sensor alarm systems because the warning signals are distributed across multiple variables and develop too gradually to trigger any individual threshold. These are not edge cases or theoretical possibilities. They are the routine, repeatable failures that drive the majority of unplanned downtime in cement operations, and they are all detectable with the right multi-sensor correlation model running on data that the plant is already collecting.
Rotary Kiln Riding Ring and Support Roller Bearings
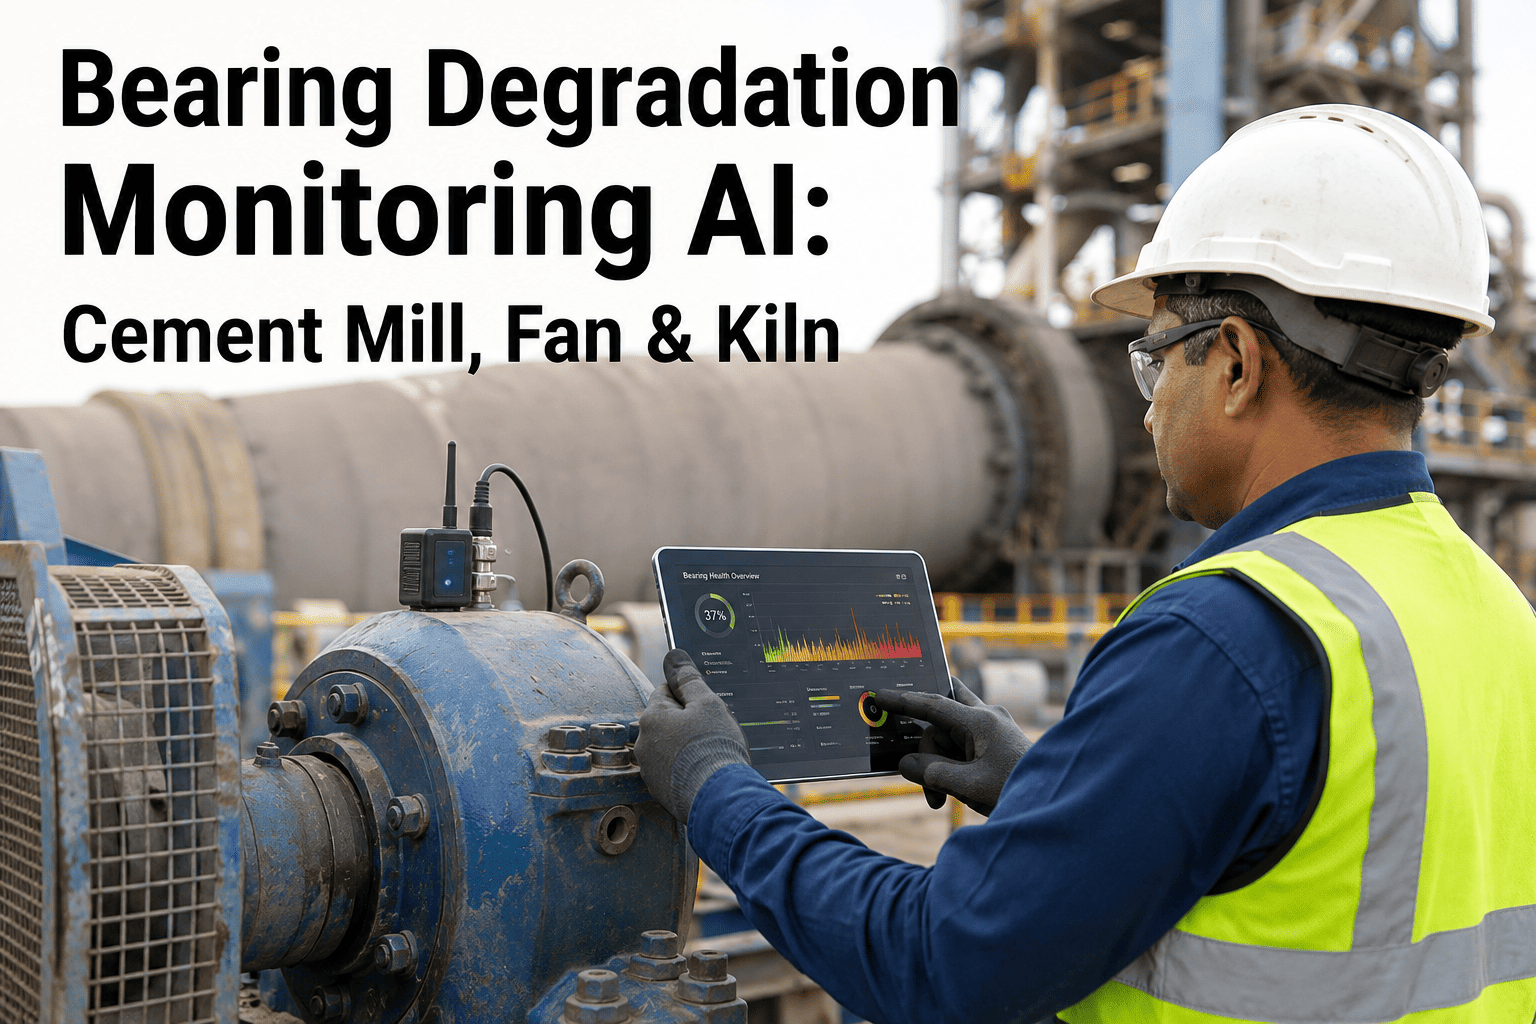
The earliest sign of bearing degradation in kiln support rollers is not a vibration spike, it is a subtle change in the relationship between vibration amplitude, bearing temperature, and the hydraulic pressure required to maintain roller position. A healthy roller shows a predictable correlation between these three variables as kiln load changes. As the bearing degrades, that correlation breaks down gradually, with vibration increasing slightly faster than temperature and hydraulic pressure deviating from its expected range under the same load conditions. This pattern can develop over three to six weeks before any single variable crosses its alarm limit, and AI detection catches the correlation break in the first week.
Vertical Raw Mill Grinding Table and Rollers
As grinding elements wear in a vertical roller mill, the relationship between mill motor power, differential pressure across the mill, feed rate, and vibration changes in a predictable way that reflects the changing grinding dynamics. Traditional alarms might catch an extreme vibration event when a roller loses contact or a hard piece of material enters the grinding zone, but the gradual change in the power-to-pressure-to-vibration ratio that indicates progressive wear passes completely unnoticed. AI detection identifies the shifting multi-variable pattern and flags it as a degradation trend tied to grinding element wear, giving the maintenance team weeks to plan a roller change during a scheduled stop instead of reacting to a sudden failure during peak production.
Cement Mill Classifier and Separator Performance
A degrading separator rotor or worn classifier blades changes the relationship between mill output, product fineness, separator speed, and circulating load. Individually, each of these parameters can drift within normal ranges while the overall grinding efficiency is declining. The first visible symptom is usually a gradual increase in specific energy consumption that gets attributed to clinker quality changes or other factors. AI detection correlates the full set of mill operating parameters and identifies the separator-related pattern shift before the efficiency loss becomes large enough to show up in monthly production reports, giving the team time to inspect and replace worn components before the next scheduled maintenance window closes.
Grate Cooler Fan and Air Distribution Degradation
Cooler fan performance degradation affects clinker cooling efficiency, secondary air temperature entering the kiln, and overall thermal efficiency, but the individual fan motor current and air flow readings often remain within alarm limits even as the actual cooling capacity declines. The real indicator is a slow shift in the correlation between fan current, cooler undergrate pressure, clinker discharge temperature, and secondary air temperature. AI detection identifies this multi-variable drift as a cooler air distribution problem rather than a kiln burning issue, which prevents the common misdiagnosis where teams spend days adjusting kiln parameters when the actual problem is underneath the cooler plates.
Bag Filter Differential Pressure and Cleaning System
Bag filter performance degrades through a combination of bag wear, cleaning system malfunctions, and gradual blinding that changes the relationship between differential pressure, cleaning cycle frequency, gas volume, and dust emission levels. A stuck cleaning valve might reduce cleaning effectiveness on one compartment, causing a slow DP rise that stays below the high alarm but shifts the cleaning frequency pattern in a way that single-point monitoring cannot detect. AI correlation catches the abnormal cleaning-to-DP relationship early, allowing a targeted inspection of the cleaning system before the compartment reaches a point where bags are permanently damaged and require premature replacement.
MEASURABLE OUTCOMES
What Cement Plants Actually Report After Deploying AI Anomaly Detection on SCADA Data
These outcomes are based on documented results from cement plants that have deployed multi-sensor AI anomaly detection alongside their existing SCADA alarm infrastructure over periods of six to eighteen months. The numbers vary by plant size, equipment age, and how aggressively the maintenance team acts on early detection alerts, but the directional improvement is consistent across every plant that has implemented the technology with a structured response process behind it. The single most important predictor of whether a plant achieves these outcomes is not the sophistication of the AI model but whether the maintenance team has a defined process for responding to Tier 2 and Tier 3 alerts within the timeframes the alert structure specifies.
30-65%
Reduction in unplanned downtime for monitored rotating equipment
2-4 Weeks
Average early warning time before a threshold alarm would have fired for the same failure
40-60%
Reduction in false positive alerts compared to traditional alarm systems during process upsets
15-25%
Reduction in emergency spare parts consumption for bearings, seals, and grinding components
FREQUENTLY ASKED QUESTIONS
Questions Cement Plant Leaders Ask Before Deploying AI Anomaly Detection on SCADA
Does AI anomaly detection replace our existing SCADA alarm system?
No, it operates as a parallel detection layer alongside your existing alarms. Your threshold alarms remain the fastest way to catch sudden single-point failures like a sensor wire break or an immediate pressure spike. AI anomaly detection adds the ability to catch the slow, multi-variable degradation patterns that threshold alarms are architecturally incapable of detecting. Plants that try to replace threshold alarms entirely with AI detection typically find that they lose the ability to catch the fast failures while gaining the ability to catch the slow ones, when what they actually needed was both.
Book a demo to see how iFactory layers AI detection on top of your existing SCADA alarms.
How much historical data does the AI model need before it starts producing reliable detections?
The baseline learning phase typically requires four to eight weeks of continuous SCADA data for each monitored asset, assuming the data covers normal operating conditions including production rate variations and typical process adjustments. If the historical data is already available in your SCADA historian, iFactory can backfill the model training period so that the system is producing detections from day one of the live deployment. The model continues learning and refining its baseline after going live, so detection accuracy improves over the first few months as it encounters a wider range of operating conditions.
Contact our support team to discuss your data availability and timeline.
What happens when we change operating conditions, like switching to a different fuel or clinker recipe?
The AI model treats known operational changes as legitimate mode shifts rather than anomalies, provided the change is either registered in the system by the operator or the model has seen enough similar transitions in its training data to recognize the pattern. A planned fuel switch from coal to alternative fuel, for example, creates a predictable shift in kiln temperature profiles, gas analysis readings, and fan operating points that the model learns to associate with that mode. The model will still flag genuinely abnormal behavior within the new mode, such as a bearing temperature that deviates from the expected pattern for the new operating condition, which is exactly the detection capability you want to preserve during transitions.
Book a demo to see how mode handling works in practice.
How do we prevent the AI system from generating so many alerts that operators start ignoring them?
The three-tier alert structure is specifically designed to prevent alert fatigue by matching notification urgency to actual risk level. Tier 1 Watch alerts do not generate active notifications at all, they simply appear on the monitoring dashboard for review. Tier 2 Warning alerts go to the maintenance planner through a defined channel with a clear expected response timeframe. Tier 3 Critical alerts are the only ones that generate immediate notifications to shift supervisors and maintenance managers. This structure means that operators and planners receive a small number of high-confidence, actionable alerts rather than a flood of low-confidence notifications, which is the fundamental difference between a system that builds trust and one that destroys it.
Contact our support team for guidance on configuring alert thresholds for your plant.
Can this work on older SCADA systems, or do we need to upgrade our infrastructure first?
iFactory connects to your SCADA historian, not to the SCADA system itself, which means the integration point is the data archive that almost every SCADA system already maintains regardless of age. As long as your historian can export data through a standard interface such as OPC UA, ODBC, or a file-based export, the AI layer can ingest it without any changes to your SCADA front-end, alarm configuration, or operator displays. Plants running SCADA systems that are ten or fifteen years old have deployed this approach successfully because the data quality in the historian is what matters, not the version of the SCADA software that wrote it.
Book a demo to discuss compatibility with your specific SCADA and historian setup.
Your SCADA Data Is Already Detecting Failures, It Just Needs the Right Model to Make Them Visible
iFactory's AI anomaly detection layer connects to your existing SCADA historian, learns your equipment's normal behavior, and starts catching the multi-sensor patterns your alarms are missing, without replacing anything you already have.