Every cement plant running a waste heat recovery system depends on one unglamorous piece of equipment to deliver the energy savings on paper: the gas duct connecting the kiln, preheater, or clinker cooler to the boiler. When that duct develops leakage, its refractory insulation degrades, or dust fouling builds up along its walls, the plant quietly loses exhaust gas volume, temperature, and flow rate before the WHR boiler ever sees it. Reliability teams often chase turbine and boiler performance while the duct itself, sitting in plain sight, erodes the recovery numbers from the source. Talk to iFactory support about a WHR duct condition assessment for your plant.
Cement · WHR Efficiency · Gas Duct Maintenance
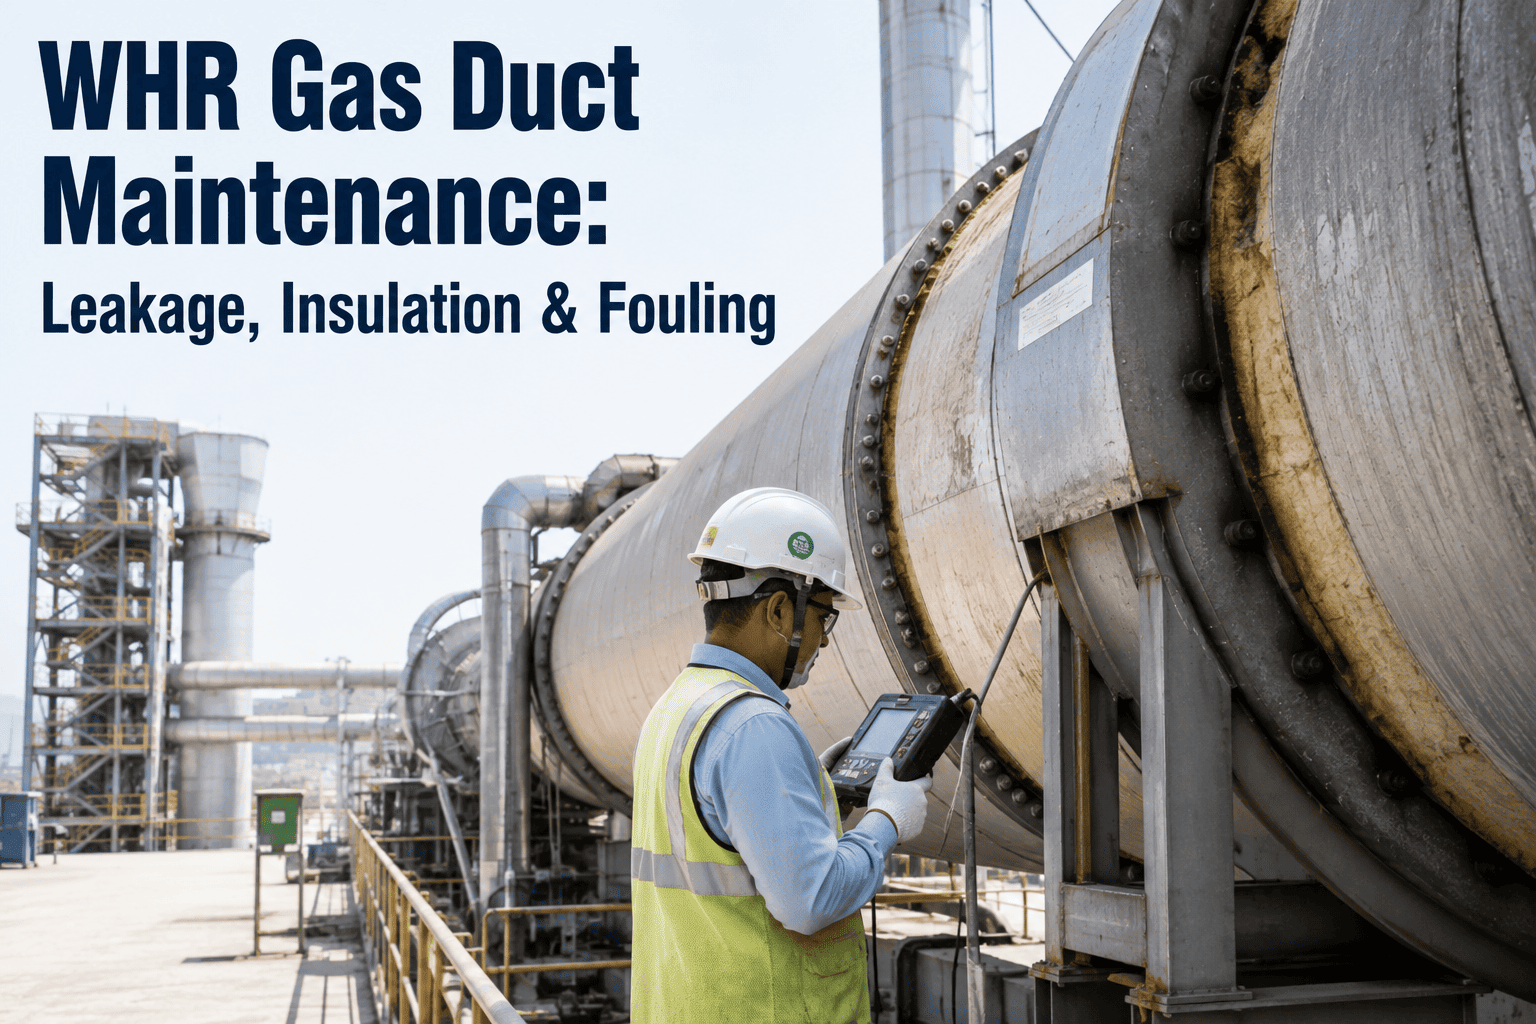
WHR Gas Duct Maintenance: Leakage, Insulation and Fouling Control
The gas duct between your kiln system and your WHR boiler is the single point where recoverable heat is won or lost before generation even begins. Here is what leakage, insulation breakdown, and fouling actually cost, and how to catch them early.
3–8%
Typical exhaust gas energy lost to duct leakage in plants that have not audited ductwork in over two years
15–40°C
Gas temperature drop across a long duct run with degraded or missing insulation sections
6–12 Mo
Typical interval before dust fouling on duct walls begins measurably restricting gas flow
Three Failure Points
Leakage, Insulation, and Fouling Are Three Different Problems With One Shared Effect
A WHR boiler is only ever as good as the gas it receives. Duct condition determines three variables the boiler cannot compensate for: how much gas actually arrives, how hot it is when it arrives, and how freely it moves through the system. Each of the three failure modes below attacks a different one of those variables, and most plants only discover the combined loss once a boiler performance audit already shows underrecovery.
Leakage — Volume Loss
Cracked expansion joints, corroded shell seams, and loose access door gaskets let exhaust gas escape or draw in cold ambient air before it reaches the boiler economizer. Volume loss directly reduces the mass flow available for heat exchange, and ambient air ingress dilutes gas temperature at the same time, compounding the loss on two fronts rather than one.
Insulation — Temperature Loss
Refractory lining and external insulation keep exhaust gas hot as it travels from the kiln riser or cooler outlet to the boiler inlet, sometimes over a duct run of a hundred meters or more. Where lining has cracked, spalled, or been left unrepaired after a shutdown, gas temperature falls steadily along the route, arriving at the boiler cooler than the design basis assumed.
Fouling — Flow Loss
Dust carried in kiln exhaust settles inside duct bends, expansion sections, and low-velocity zones over time. As the deposit layer thickens, it narrows the effective cross-section, raises pressure drop, and forces the induced draft fan to work harder for the same gas volume, which increases parasitic power draw even as boiler input volume falls.
Visual Breakdown
How a Leaking Duct Section Develops — Five Stages From First Crack to Measurable Loss
1
Micro-Crack Forms
Thermal cycling from kiln startups and shutdowns stresses weld seams and expansion joints, producing a hairline crack too small to detect by sight or basic inspection.
2
Localized Air Ingress
Under negative draft, ambient air is pulled through the crack into the duct, slightly cooling gas temperature at that point without any visible external sign of a problem.
3
Crack Widens Under Cycling
Repeated thermal expansion and contraction enlarges the original crack, and vibration from fan operation accelerates the widening along the weakest points of the seam.
4
Measurable Volume Loss
Gas volume and temperature reaching the boiler begin to drop in a way that shows up in boiler steam or power output trends, though the root cause is rarely obvious from those trends alone.
5
Structural Repair Required
Left unaddressed, the crack progresses to a point requiring shell plate replacement or major weld repair during a planned shutdown, at a far higher cost than early sealing would have needed.
Insulation Condition
Grading Duct Insulation Condition — What Each Grade Means for Recovery
Insulation does not fail all at once. It degrades in a predictable sequence, and each stage has a distinct effect on the gas temperature reaching the boiler. Reliability teams that grade insulation condition on a simple scale can prioritize repair spend on the sections doing the most damage first, rather than re-lagging an entire duct run uniformly.
Fouling Progression
Four Stages of Duct Fouling — From Light Dusting to Flow Restriction
Stage 1 — Light Dusting
A thin, uniform dust film coats low-velocity zones such as bends and expansion sections. Pressure drop is unchanged and no fan power increase is measurable at this stage.
Stage 2 — Layer Buildup
Dust accumulates into a defined layer several centimeters thick in the slowest-flow sections. Draft fan amps begin trending upward slightly as static pressure requirements rise.
Stage 3 — Partial Blockage
Buildup narrows the effective cross-section enough to noticeably restrict flow at specific points, and gas velocity through the remaining opening increases, accelerating erosion of nearby surfaces.
Stage 4 — Flow-Limiting
Fan power rises significantly to maintain design flow, boiler input volume drops regardless of fan effort, and manual cleaning during a shutdown becomes the only remaining option.
Leakage, Insulation Loss, and Fouling Rarely Show Up Until Boiler Output Already Has
iFactory tracks duct condition indicators alongside your WHR boiler and turbine data, so a temperature drop or draft fan power increase gets traced back to the duct section causing it, not left buried inside an overall efficiency number.
Measured Impact
What Plants Recover When Duct Condition Is Actively Managed
3–8%
Volume Recovery From Sealing
Closing identified leakage points along a duct run typically restores several percentage points of exhaust gas volume to the boiler inlet within the same operating cycle.
10–20°C
Temperature Recovery From Re-Lagging
Repairing Grade C and Grade D insulation sections commonly restores double-digit temperature gains at the boiler inlet, directly improving steam generation potential.
5–12%
Fan Power Reduction From Cleaning
Removing fouling deposits before they reach the flow-limiting stage lowers induced draft fan power draw for the same gas volume delivered.
Earlier
Detection Ahead of Boiler Trends
Duct-level monitoring flags degradation before it becomes visible in aggregate boiler output figures, giving maintenance teams a longer planning window.
Field Example
A 4,500 TPD Line Traced a Stalled WHR Output Gain Back to One Duct Section
A cement plant operating a 4,500 tonne-per-day kiln line had commissioned a WHR retrofit two years earlier and had seen power output plateau roughly 9% below the original design target for the past several months. The turbine and boiler had both passed routine performance checks individually, which pointed maintenance attention away from the ductwork connecting the preheater exhaust to the boiler. A thermal scan of the duct run, combined with draft fan power trending, showed a 60-meter section with Grade C insulation damage near an expansion joint and a partial fouling buildup just downstream of a 90-degree bend. The insulation section was re-lagged and the fouling cleared during the next planned stop, a combined intervention of under three days. Boiler inlet gas temperature rose by 14°C and induced draft fan power dropped by 7% for the same flow rate, closing most of the gap to the original design output without any change to the boiler or turbine themselves.
14°C
Gas temperature gain after insulation repair
7%
Fan power reduction after fouling cleared
Under 3 Days
Combined repair window during a planned stop
9% Gap
Design output shortfall traced to a single duct section
Common Questions
WHR Gas Duct Maintenance — What Cement Plant Teams Ask First
How can we tell whether a boiler output drop is coming from the duct or from the boiler itself?
The clearest signal is checking gas temperature and volume at the duct inlet versus the boiler inlet rather than only looking at boiler output in isolation. If inlet conditions at the duct entrance look normal but temperature or flow has fallen by the time gas reaches the boiler, the loss is happening somewhere along the duct run itself. A thermal scan of the external casing combined with draft fan power trending usually narrows the location further before any physical inspection is needed.
Contact support to set up duct-level monitoring alongside your existing boiler instrumentation.
How often should duct insulation condition actually be inspected?
Most plants benefit from a full thermal scan of major duct runs once or twice a year, with a more frequent visual check of known problem areas such as expansion joints and access doors during routine rounds. Duct sections exposed to frequent thermal cycling, such as those near startup or bypass points, tend to degrade faster than steady-state sections and may need more frequent attention.
Book a demo to see how condition trends can be tracked automatically between inspection cycles.
Does fouling buildup rate differ much between plants, or is it fairly predictable?
Fouling rate depends heavily on raw material characteristics, kiln operating mode, and duct geometry, so it varies meaningfully from plant to plant and even between duct sections within the same plant. Bends, expansion sections, and any point where gas velocity drops are consistently the first places buildup accumulates, regardless of the specific material being processed. Tracking draft fan power over time is generally a more reliable early indicator than trying to estimate buildup rate from material data alone.
Is duct leakage usually caused by original construction quality or by operating conditions over time?
Both contribute, but operating conditions tend to dominate over the life of the duct. Thermal cycling from kiln startups, stops, and load changes places repeated stress on welds and expansion joints regardless of how well the duct was originally fabricated, and this stress accumulates gradually rather than appearing as a single failure event. Duct sections near frequent-cycling equipment, such as bypass or startup lines, typically show leakage earlier than steady-state sections for this reason.
Contact support for guidance on prioritizing inspection by duct section risk.
What is the realistic payback period for repairing a duct section versus leaving it until the next major shutdown?
In most cases the recovered volume, temperature, or fan power savings pay back the repair cost well within a single operating cycle, often within weeks, because the loss is continuous while the repair is a one-time cost during a planned stop. Waiting until the next major shutdown means accepting the ongoing loss for however many months remain until that stop, which in cases of significant leakage or fouling can outweigh the cost of an earlier targeted repair many times over.
Book a demo to model the recovery case for your specific duct condition.
Your WHR Boiler Can Only Recover the Heat That Actually Reaches It
iFactory monitors duct-level indicators like gas temperature drop, draft fan power trends, and casing thermal patterns alongside your boiler and turbine data, so leakage, insulation loss, and fouling get caught before they show up as a permanent gap in output.