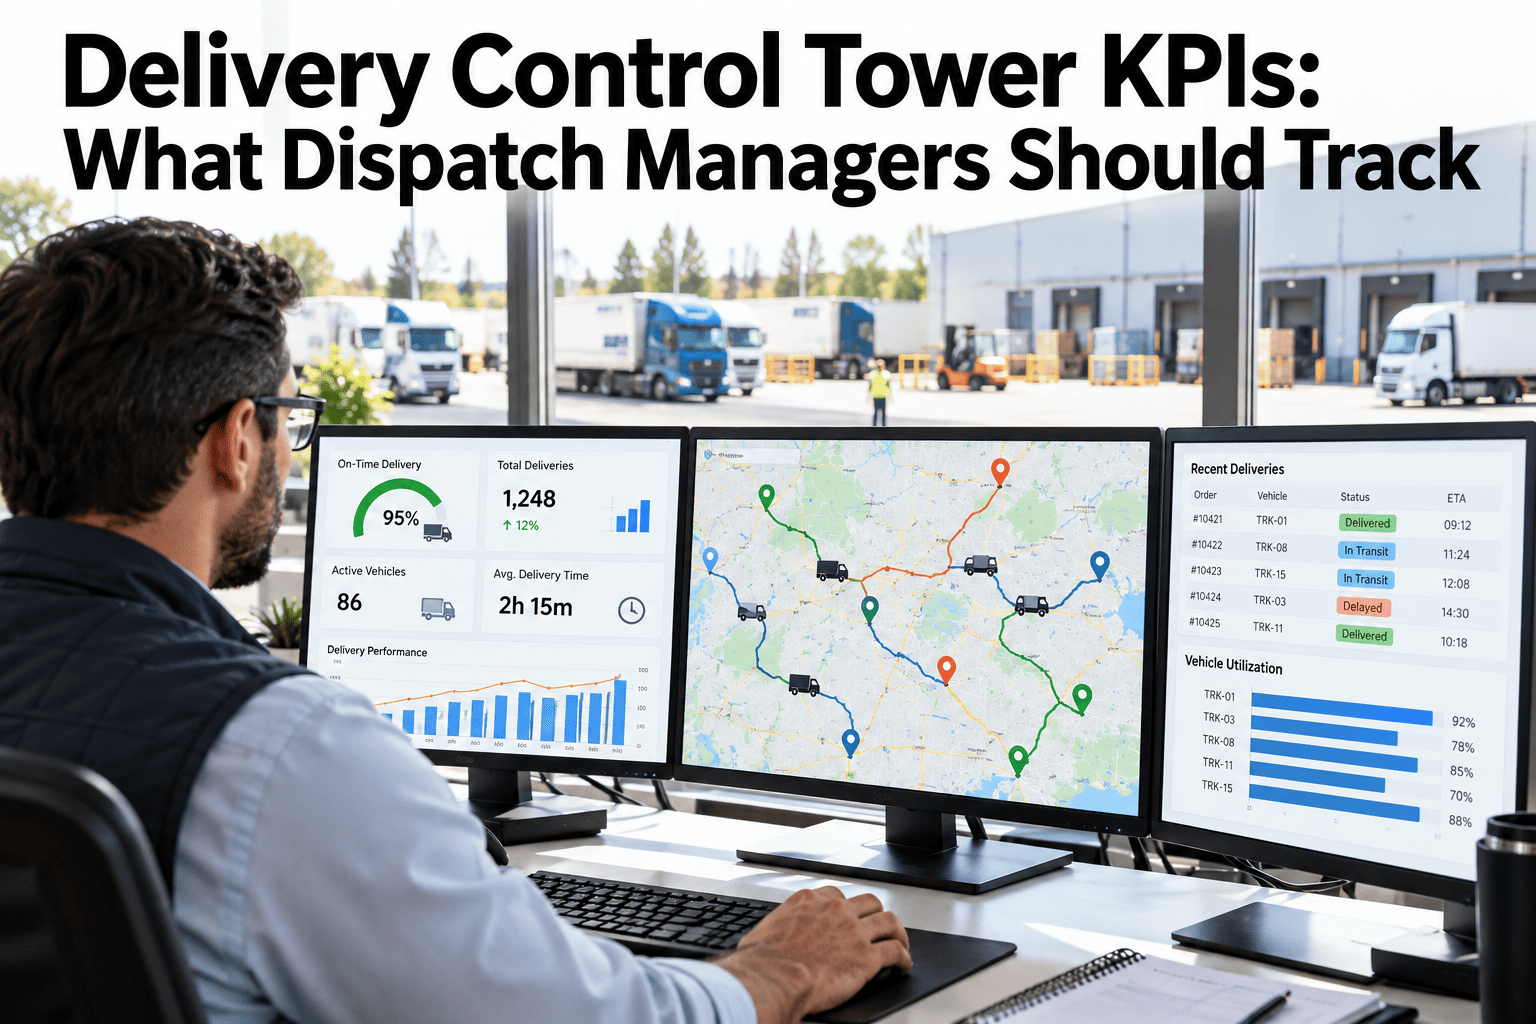
Dispatch managers are handed dashboards full of numbers and still end the day unsure whether the operation is improving. The problem is rarely a lack of metrics. It is too many, with no thresholds and no link to the next decision. A control tower works when a small set of measures answers three questions: are we delivering on time, where is time being lost and what needs escalating now. Delivery teams can build a focused control tower KPI view from their own dispatch data and see which numbers drive action.
Track Seven Numbers That Change What Dispatch Does Next
iFactory helps dispatch managers focus on on-time delivery, dwell time, failed attempts, cost per stop, backlog and exception aging, with thresholds that trigger action.
Seven KPIs and What Each One Tells You
Each KPI answers a different question. Together they give a balanced picture.
| KPI | What It Measures | Watch Out For |
|---|---|---|
| On-time delivery | Share of deliveries inside the promised window | Window definitions that differ by customer |
| Dwell time | Time vehicles or loads wait at a site or dock | Averages that hide long waits |
| Failed attempts | Deliveries not completed on the first attempt | Missing or vague reason codes |
| Cost per stop | Cost of delivery divided by stops made | Mixing different route types |
| Backlog | Orders waiting to be dispatched or delivered | Backlog counted without age |
| Exception aging | How long open exceptions have been unresolved | Old exceptions ignored in averages |
| Escalation rate | Share of exceptions that needed escalation | Too few or too many escalations |
A Control Tower Layout That Fits One Screen
Put the most urgent view at the top and the supporting detail underneath.
Schematic layout. The final screen is built around your roles and decisions.
Which KPIs Matter Most to Which Role
The same data serves everyone, but each role watches different numbers.
Illustrative emphasis by role. Your own roles may weigh these differently.
Escalation Thresholds in Three Bands
Thresholds turn a number into an action. Set them with the people who must respond.
Building the KPI Pack in Four Steps
Start small, agree the definitions and add measures only when they earn a place.
Build a KPI View Around Your Own Dispatch Decisions
Share the measures you track today and the decisions they should support. We will outline a focused control tower view with thresholds.
Vanity Metrics vs Action Metrics
A metric earns its place by changing a decision.
Exception Aging: From Fresh to Stale
Age shows which exceptions are drifting without anyone working them.
A Weekly Rhythm for KPI Reviews
Metrics only help if they feed a routine.
What Experienced Dispatch Managers Look For in KPIs
Frequently Asked Questions
How many KPIs should a control tower show?
Around six or seven on the main view is plenty. More tends to dilute attention, and fewer may leave blind spots. Keep supporting detail one click away for people who need it. Choose your first set of KPIs with our team using the decisions your managers make each day.
What is a good on-time delivery target?
It depends on your customers, contracts and network, so there is no universal figure. Set targets from customer commitments and recent performance, then improve in steps. Compare windows consistently, since a looser definition can make results look better without improving service.
How do we measure dwell time fairly?
Define start and stop events clearly, such as arrival at site and departure from dock, and record both for every visit. Show the spread and the worst cases, not just the average. Review how to capture dwell events from your current systems in a short session.
Should cost per stop be on the main view?
It belongs on the manager and network views more than the dispatcher view. Cost per stop depends on route type, so compare like with like. Used carefully, it shows whether service improvements are costing more or less per delivery.
How often should thresholds be reviewed?
Review them quarterly, or after a significant change in network, customers or volumes. Thresholds that are too tight create noise, while those too loose miss problems. Plan a threshold review with our team using a quarter of your own data.
Focus Dispatch on the Numbers That Move Deliveries
Bring your current KPIs and one week of dispatch data. We will show a focused control tower view and the thresholds behind it.