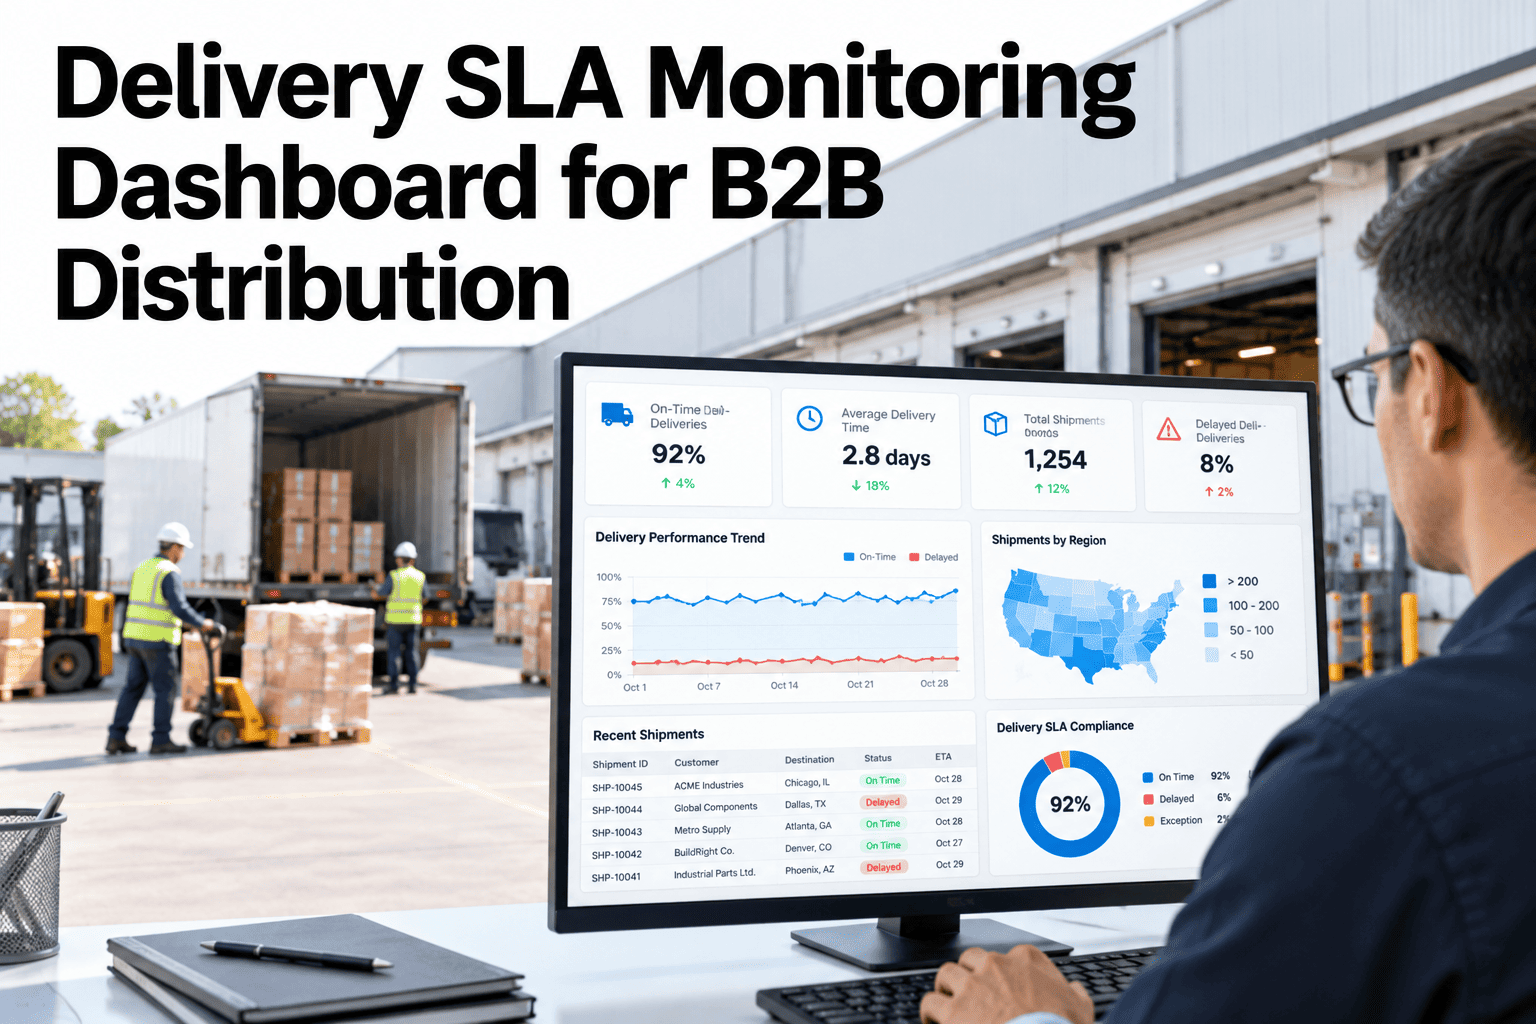
In B2B distribution, a late or incomplete delivery rarely stays a one-off. It breaks a customer's production plan, triggers a penalty clause or quietly moves the account to a competitor. Service level agreements promise a lot, yet many teams find out about breaches in a monthly report that arrives after the damage. A delivery SLA dashboard turns the promise into a live measure by customer, lane and order. Distribution leaders can see their SLA terms tracked live against recent deliveries and judge how early breaches would have shown up.
Know an SLA Is at Risk Before the Customer Does
iFactory helps distribution teams define SLAs, measure on-time-in-full by customer and lane, and act on breach alerts before they become penalties.
Turning Contract Language Into Measurable SLAs
An SLA is only monitorable once each term is turned into a rule the system can check.
| Contract Term | Measurable Rule | Typical Complication |
|---|---|---|
| Delivery within window | Arrival time inside agreed slot | Windows differ by customer and site |
| Complete order | Delivered quantity matches ordered | Partial shipments and substitutions |
| Damage-free | No damage noted at delivery | Reporting delay and disputes |
| Correct documents | Paperwork present and accurate | Missing or late proof of delivery |
| Response time | Time to acknowledge and resolve issues | Clock start and pause rules |
On Time In Full: Two Conditions, One Result
A delivery counts only when it is both on time and complete. Failing either one fails the measure.
Conceptual view. Definitions of on time and in full follow each customer contract.
Measures That Make an OTIF Number Trustworthy
A single OTIF figure hides a lot. These three elements make it reliable.
Clear time rules
Agree what counts as on time, including early arrivals and window edges
Clear quantity rules
Agree tolerance for short or over deliveries and substitutions
Clean source data
Use delivery events and confirmed quantities, not estimates
Customer and Lane Scorecards
Averages hide problems. Scorecards by customer and lane show where service is slipping.
Illustrative scorecard. Your own customers and lanes will look different.
Breach Alert Zones
Alerts should reflect how close a delivery or a customer is to breaching.
Test an SLA Dashboard on Your Last Quarter
Share SLA terms for two customers and a quarter of delivery data. We will show how each customer would have scored and where breaches could have been caught.
Monthly Report vs Live SLA Monitoring
Both are useful, but only one lets you prevent the breach.
Corrective Actions When an SLA Slips
Escalate in proportion to how persistent the slippage is.
Setting Up SLA Monitoring Step by Step
Start with your largest accounts and expand once the numbers are trusted.
What Experienced Distribution Leaders Look For in SLA Monitoring
Frequently Asked Questions
How do we handle different SLAs for different customers?
Store each customer or contract as its own rule set, with windows, tolerances and measures defined separately. The dashboard then scores each delivery against the right terms. A shared template speeds setup, since most contracts differ in parameters rather than in structure. Map your top customer terms with our team to start.
What counts as in full when we make partial shipments?
That depends on the contract. Some count a delivery as in full only when everything arrives together, while others allow tolerance or accept agreed substitutions. Write the rule down per customer and apply it consistently. Mixed rules are common, so the system should let each customer follow its own definition.
Can we show SLA results to customers?
Yes, many teams share a scorecard in regular reviews. Use the same data your own team sees so the numbers match. Showing causes and corrective actions alongside the figures builds more trust than the figures alone. Plan a customer-ready scorecard with our team before the first review.
How early can we predict a breach?
It depends on available tracking and how events are reported. With dispatch data and planned windows you can flag deliveries at risk before they run late. Position or ETA data improves accuracy. Prediction is guidance, not certainty, so alerts show how confident the system is.
How do we reduce repeat breaches?
Group breaches by lane, customer and cause, then fix the largest group first. Many repeats come from cut-off times, windows that do not match the route or recurring access problems. Review which patterns drive your repeat breaches in a short session using your own data.
Make Every SLA Visible Before It Breaks
Bring two customer contracts and a quarter of deliveries. We will show how the dashboard scores them and where breaches hide.