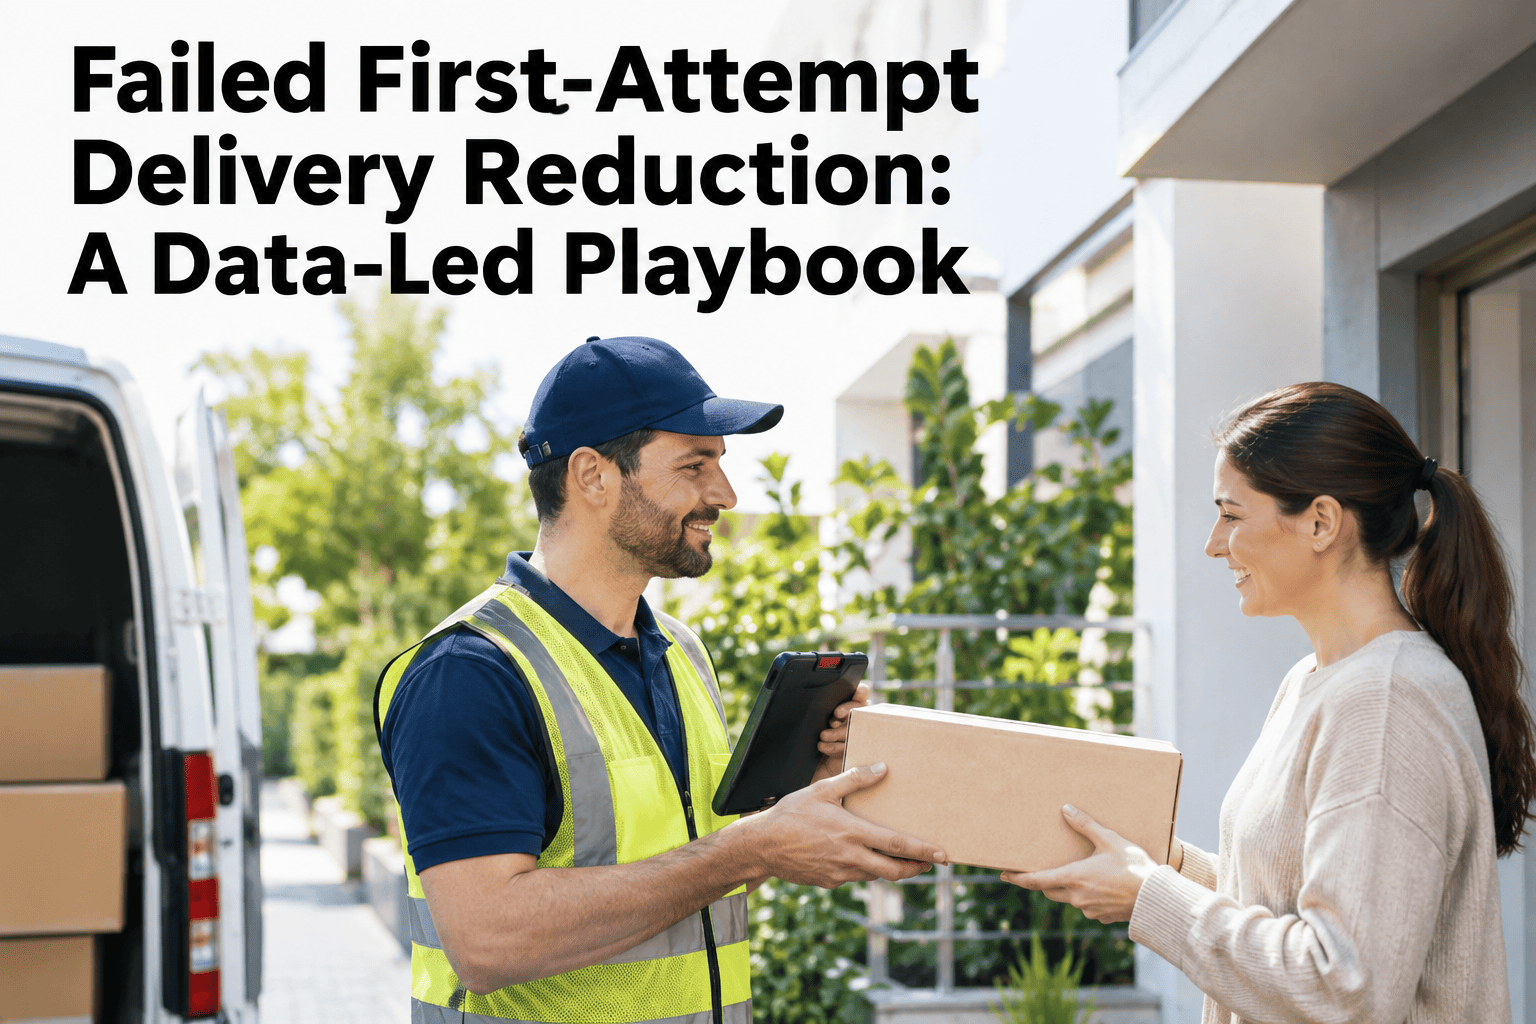
A failed first-attempt delivery rarely shows up as one clean cost line, because the driver who loses ten minutes at a bad address carries that delay into every stop still ahead of them on the route, and the redelivery itself doubles the cost of the stop. Industry reporting puts global first-attempt failure rates somewhere between 8 and 20 percent depending on market and delivery type, which at volume is a meaningful share of a delivery operation's entire cost base. iFactory AI's delivery operations team can baseline your own first-attempt success rate against this playbook before your next route planning cycle.
A Failed Delivery Never Costs Just the One Stop
Address quality, time windows, customer contact and clear delivery instructions are the four levers that move first-attempt success — and each failure avoided removes a doubled cost, not a single one.
Why First-Attempt Rate Is the Metric That Moves Everything Else
A single point of first-attempt improvement cascades through cost per stop, driver capacity, customer experience and route efficiency simultaneously, which is why operators increasingly treat it as the one number that most directly tracks last-mile profitability. The economics are straightforward: a failed attempt doesn't just lose the delivery fee, it consumes the driver's time, pushes every later stop back, and still requires a second attempt that carries its own full cost.
A wrong or incomplete address is one of the most common, and most fixable, failure causes.
A delivery arriving outside the window the customer expected is rarely accepted.
A heads-up notification before arrival measurably raises the odds someone is there.
Gate codes, building access and drop preferences captured once, used every time.
Setting a First-Attempt Success Baseline
A target means nothing without a starting point measured the same way every time. Our team can help segment your own baseline by zone, time slot and driver before setting improvement targets.
One failure taxonomy used across every zone and every driver, not a free-text field.
By zone, time slot, customer type and driver — an average alone hides where the problem actually lives.
Address issues, no-contact, wrong window and access problems, ranked by volume and cost.
Fixing the largest bucket moves the overall rate faster than spreading effort evenly.
What Moves the Needle by How Much
| Lever | Typical Impact Range | Effort to Implement |
|---|---|---|
| Address validation at order time | Meaningful reduction in address-cause failures | Low — one-time integration |
| Multi-channel delivery notifications | Up to roughly a third fewer failures | Low to moderate |
| Accurate time-window commitments | Reduces no-contact and refusal failures | Moderate — needs route capacity data |
| Captured delivery instructions | Reduces access-related failures | Low — one-time customer data capture |
Rank Your Own Failure Causes by Cost
Share a few weeks of delivery attempt data and see which of the four levers would move your first-attempt rate the most.
An Illustrative Improvement Curve
A Composite Scenario: The Zone That Looked Like a Driver Problem
Picture a delivery operation where one zone consistently ran a lower first-attempt rate than the rest of the network, with management initially assuming it reflected driver performance in that area.
Segmenting failure causes by zone showed the gap was almost entirely address-related, traced to a cluster of newly built apartment complexes not yet reflected correctly in the address database. Fixing the address data closed most of the gap without any change to driver assignment. The scenario illustrates the value of segmented data over assumption; actual causes vary by operation.
Where iFactory AI Fits
iFactory AI tracks first-attempt success segmented by zone, time slot, customer type and driver, ranking failure causes by volume and cost so effort goes to the lever that moves the rate fastest.
Rate broken down by zone, slot, customer type and driver, not one blended average.
Failure reasons ordered by cost impact, not just frequency.
Each lever's impact measured after rollout, not assumed.
Frequently Asked Questions
There's no single universal target since it varies by market and delivery type, but operations with mature address validation and notification practices commonly report rates in the low-to-mid 90s, making that a realistic benchmark for most networks. Get a benchmark for your own market.
Whichever one your own failure-cause ranking shows as the largest bucket — address quality and notifications tend to be the highest-return, lowest-effort starting points for most operations, but the right order depends on your own data. Ask for a prioritized plan based on your failure causes.
A notification before arrival gives the customer time to be present or to reschedule proactively, which converts what would have been a failed attempt into either a successful delivery or a planned reattempt that doesn't waste a driver's route slot. Review notification timing options for your delivery windows.
Captured once at the customer's first order and then surfaced to every driver on every subsequent delivery, with an easy way for the customer to update it, rather than re-asked or rediscovered on each attempt. See how instruction capture works in practice.
Weekly for an active improvement program, since failure patterns by zone and cause can shift with seasonal volume, new developments, or route changes that a monthly review would catch too late. Set a review cadence for your delivery operation.
Stop Paying Twice for the Same Delivery
iFactory AI tracks first-attempt success by zone, slot and cause, so improvement effort goes where it actually pays off first.