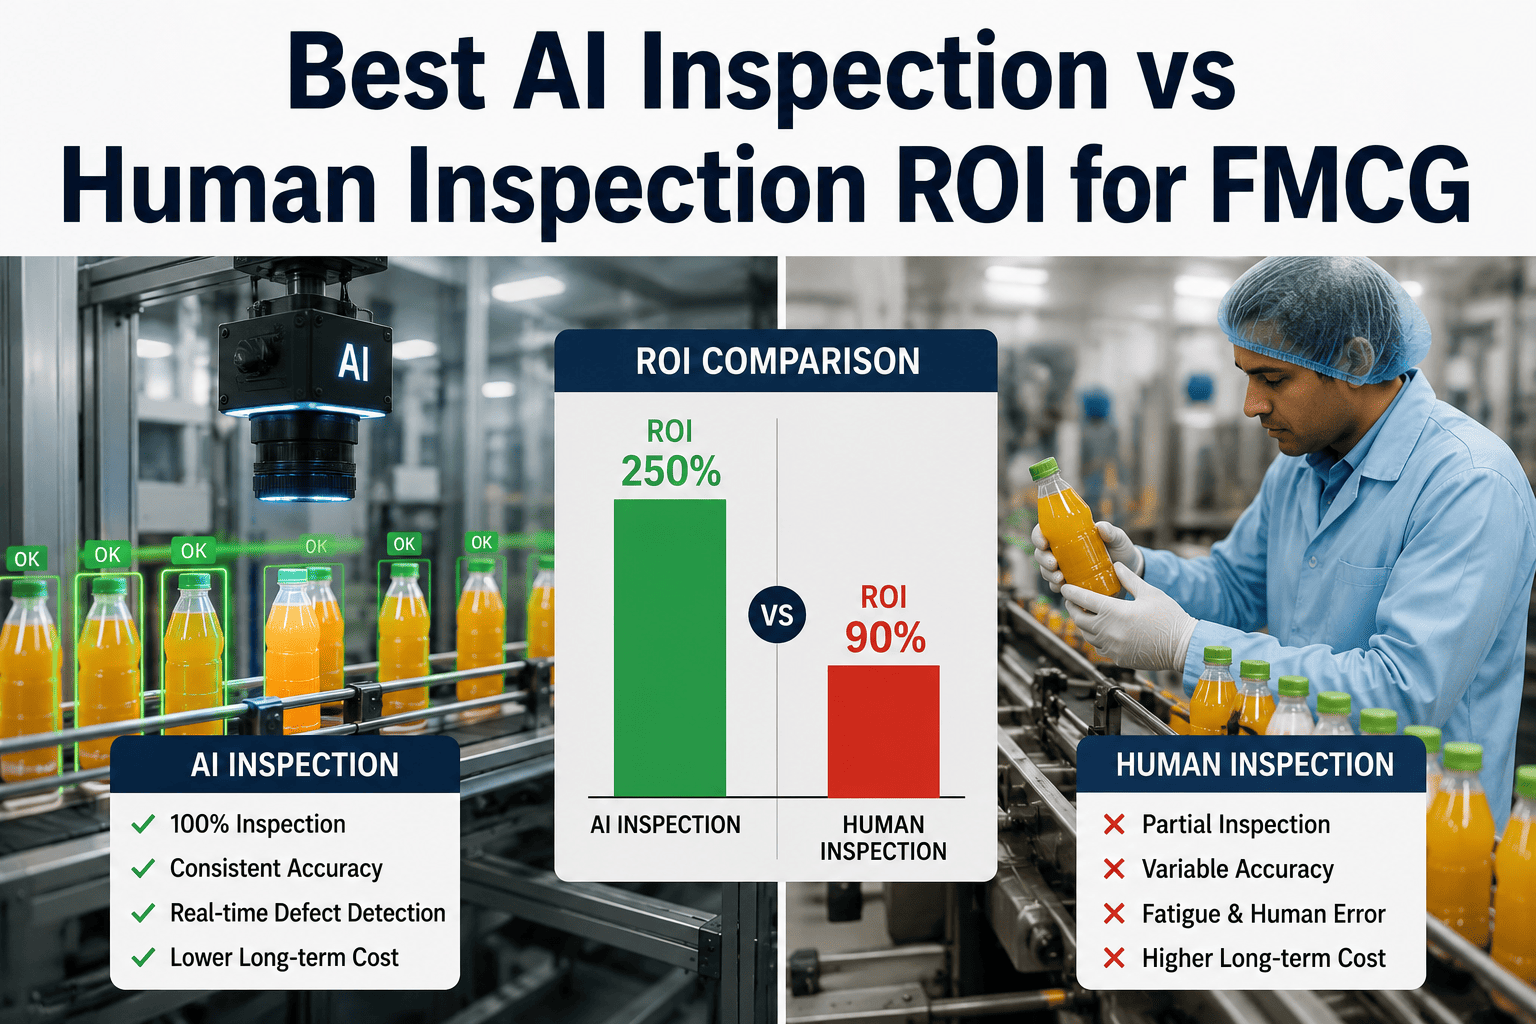
Every plant manager who has sat through a vendor pitch for AI inspection has heard some version of the claim that it pays for itself within a year. Few of those pitches show the actual math behind that number, and fewer still separate the labor savings from the harder-to-quantify but often larger value sitting in avoided complaints, avoided recalls, and reduced downgrade losses that a plant's own accounting system was never set up to track in one place.
AI Inspection vs Human Inspection ROI, Broken Down Into the Four Numbers That Actually Matter
Labor cost, defect escape rate, complaint reduction, and recall risk, quantified separately and then combined into a payback estimate built from your plant's own production data.
Human Inspection and AI Inspection Compared Factor by Factor
| Factor | Human Inspection | AI Vision Inspection |
|---|---|---|
| Coverage per shift | Sampled, subject to fatigue after roughly the first hour | Continuous, one hundred percent of units, consistent for the full shift |
| Labor cost structure | Ongoing headcount cost across every shift, every day | Fixed deployment cost plus modest maintenance, no per-shift labor scaling |
| Defect escape rate | Rises measurably as shift fatigue and line speed increase | Stable regardless of shift length or line speed within rated capacity |
| Consistency across inspectors | Varies by individual judgment and training level | Applies the same trained criteria to every unit, every time |
| Traceability of defects | Limited to manual logs and reject counts | Logged automatically by defect category, time, and line position |
Labor Cost Is the Easiest Number to Quantify, and the Smallest Part of the Story
Labor cost is usually the first number a plant reaches for when justifying an inspection upgrade, because it is the most visible line item and the easiest to calculate. Multiplying inspector headcount by shift hours and loaded labor cost gives a clean annual figure, and comparing that against a system's deployment and maintenance cost produces a straightforward payback calculation that finance teams find easy to approve.
The trouble with stopping at labor cost is that it is frequently the smallest of the four factors in the full picture, particularly for a plant where inspectors are performing other tasks alongside quality checks rather than dedicated full-time to inspection. Treating labor cost as the whole business case, rather than one input among four, understates the actual value of continuous inspection and can make a genuinely strong project look marginal on paper.
Defect Escape Rate Is Where the Real Difference Usually Shows Up
Defect escape rate, the share of actual defects that make it past inspection undetected, is harder to measure than labor cost but usually accounts for a larger share of the total financial impact. Human inspection catch rates decline measurably over the course of a shift, particularly on high-speed lines where an inspector has a fraction of a second to evaluate each unit, while a properly tuned AI vision system maintains a consistent detection rate across an entire shift regardless of line speed within its rated capacity.
Quantifying this factor requires a baseline measurement of current escape rate, typically established by re-inspecting a sample of units that passed the existing process, before any AI system is introduced. This baseline is the single most important number in the entire ROI calculation, because every downstream benefit, fewer complaints, fewer recalls, less rework, traces back to how many defects were previously escaping and are now being caught.
Build a payback estimate from your own escape rate data
iFactory starts every ROI conversation by measuring your plant's actual current defect escape rate, not an industry average.
Complaint Reduction Connects Escape Rate to a Cost the Business Already Tracks
Most FMCG companies already track customer and retailer complaints as a KPI, which makes this factor a useful bridge between the technical escape rate number and a metric the wider business already understands and cares about. A reduction in defect escape rate should show up, with some time lag, as a reduction in complaint volume tied to the specific defect categories the inspection system addresses.
The important caveat here is timing and attribution. Complaint volume is a lagging indicator that reflects defects shipped weeks or months earlier, and it is influenced by other variables, promotional volume changes, seasonal demand, and formulation changes among them, so isolating the inspection system's specific contribution requires comparing complaint trends for the specific defect categories the system targets, rather than total complaint volume across every category.
Recall Risk Is the Hardest Factor to Quantify and the Largest When It Materializes
Recall risk is fundamentally different from the other three factors because it is a low-probability, high-severity cost rather than a steady recurring one. Most plants never experience a recall tied to a defect category an inspection system would have caught, which makes it tempting to leave this factor out of an ROI model entirely. Doing so, however, ignores that the expected cost of a rare but severe event, probability multiplied by consequence, can still represent a meaningful share of total risk exposure even when the probability in any given year is small.
A more defensible approach treats recall risk as an insurance-like value rather than a guaranteed annual saving, quantified using the plant's own historical incident rate where available, or industry incident data as a conservative proxy where a plant has no direct history to draw from. This factor is rarely the deciding number in a project approval, but it is worth stating explicitly rather than omitting, since ignoring it entirely understates the full value of the investment.
A Simple Structure for Combining All Four Factors
Common Questions on AI vs Human Inspection ROI
Get a Payback Estimate Based on Your Plant's Actual Data
iFactory helps you measure escape rate, labor allocation, and complaint history before recommending anything, so the ROI case reflects your line, not an industry average.