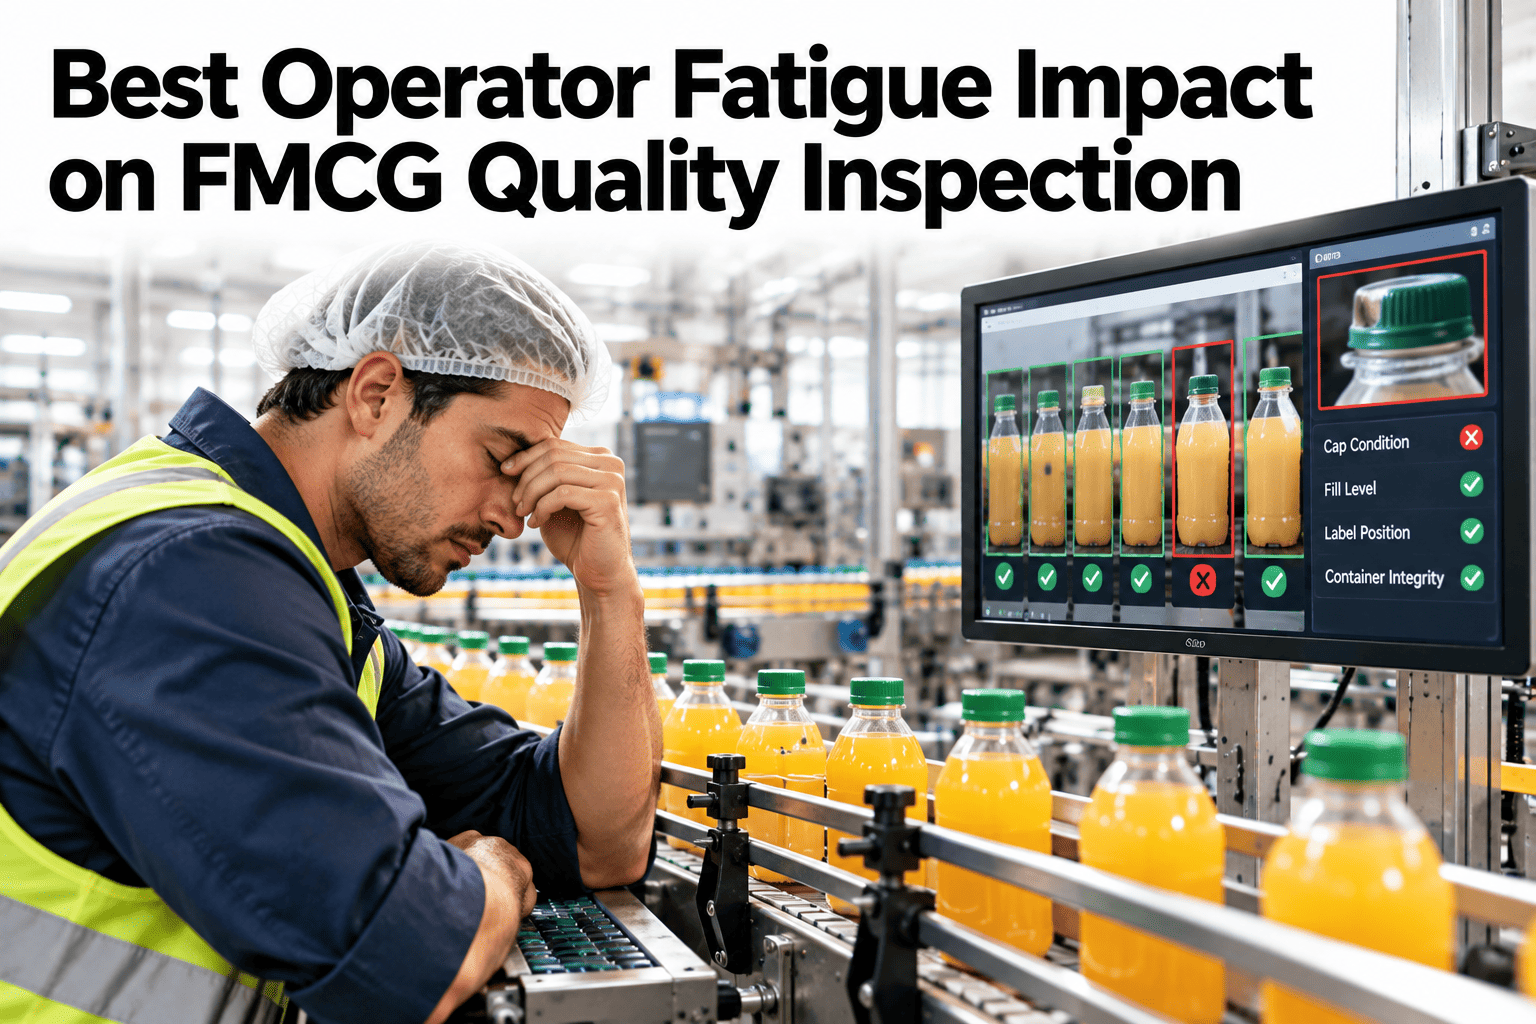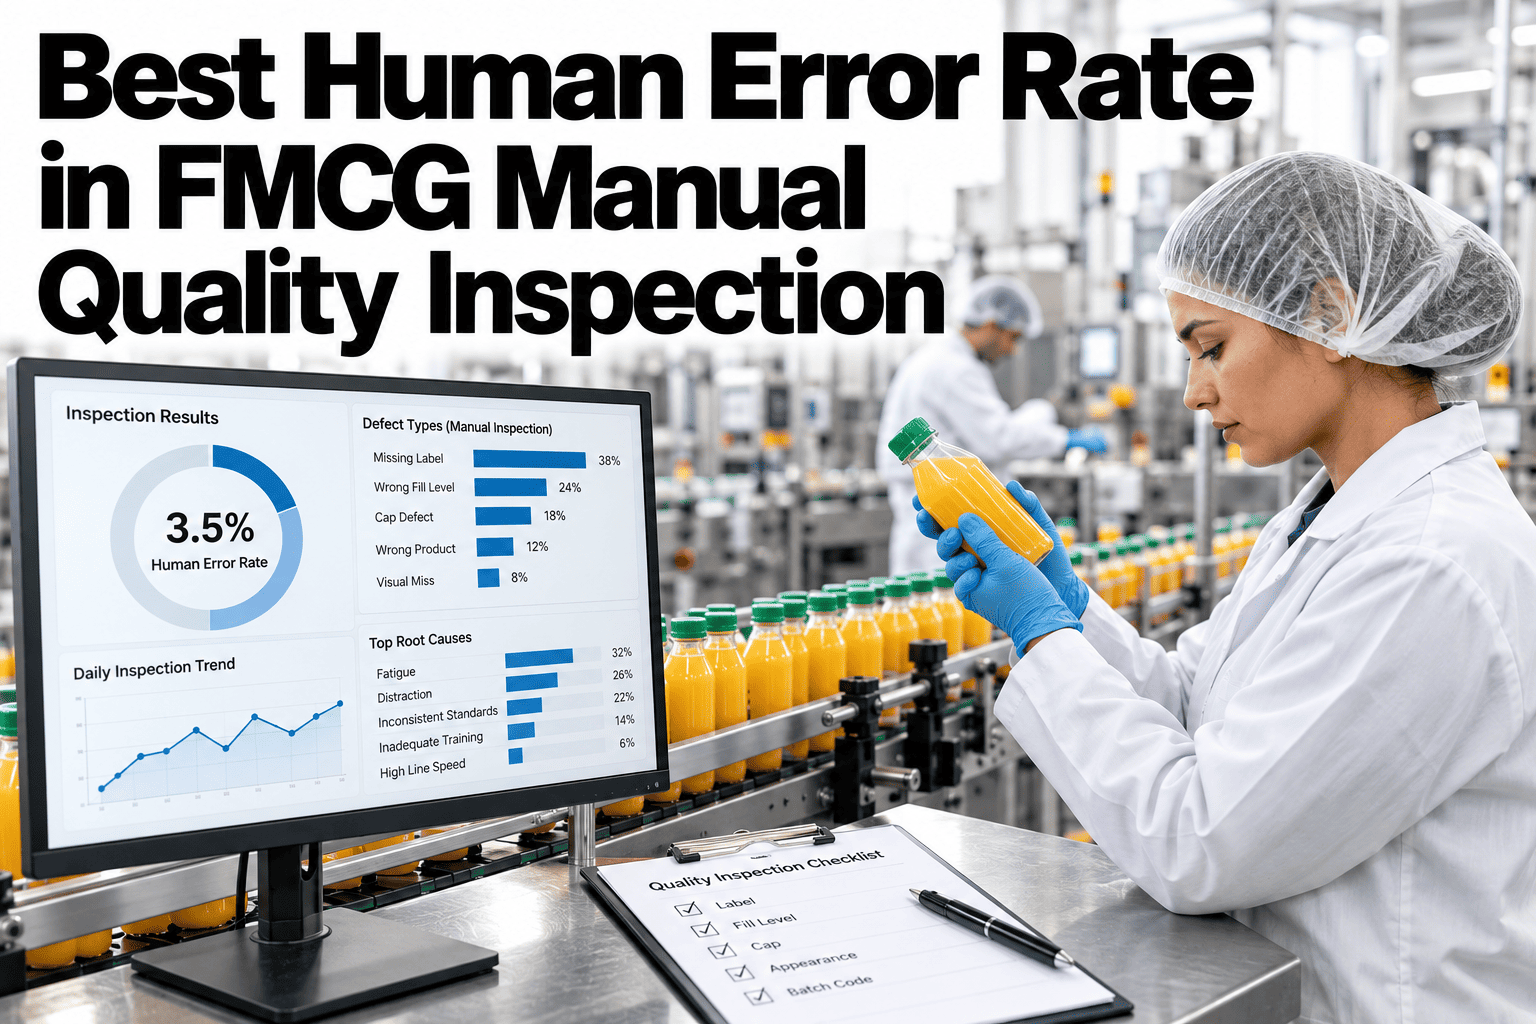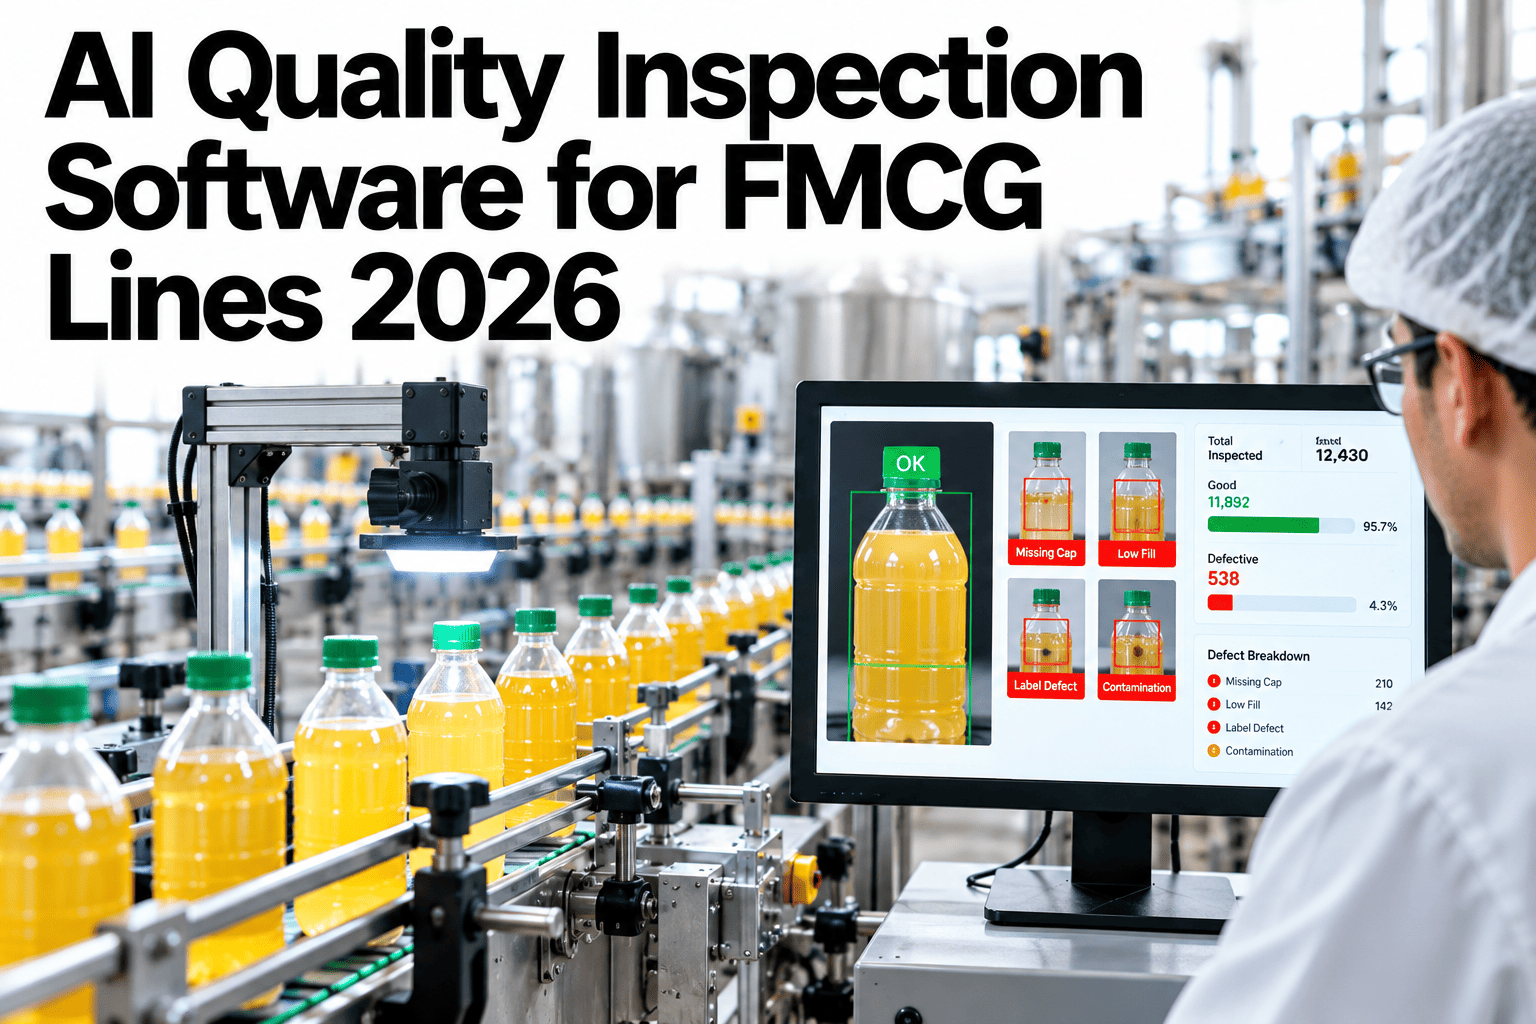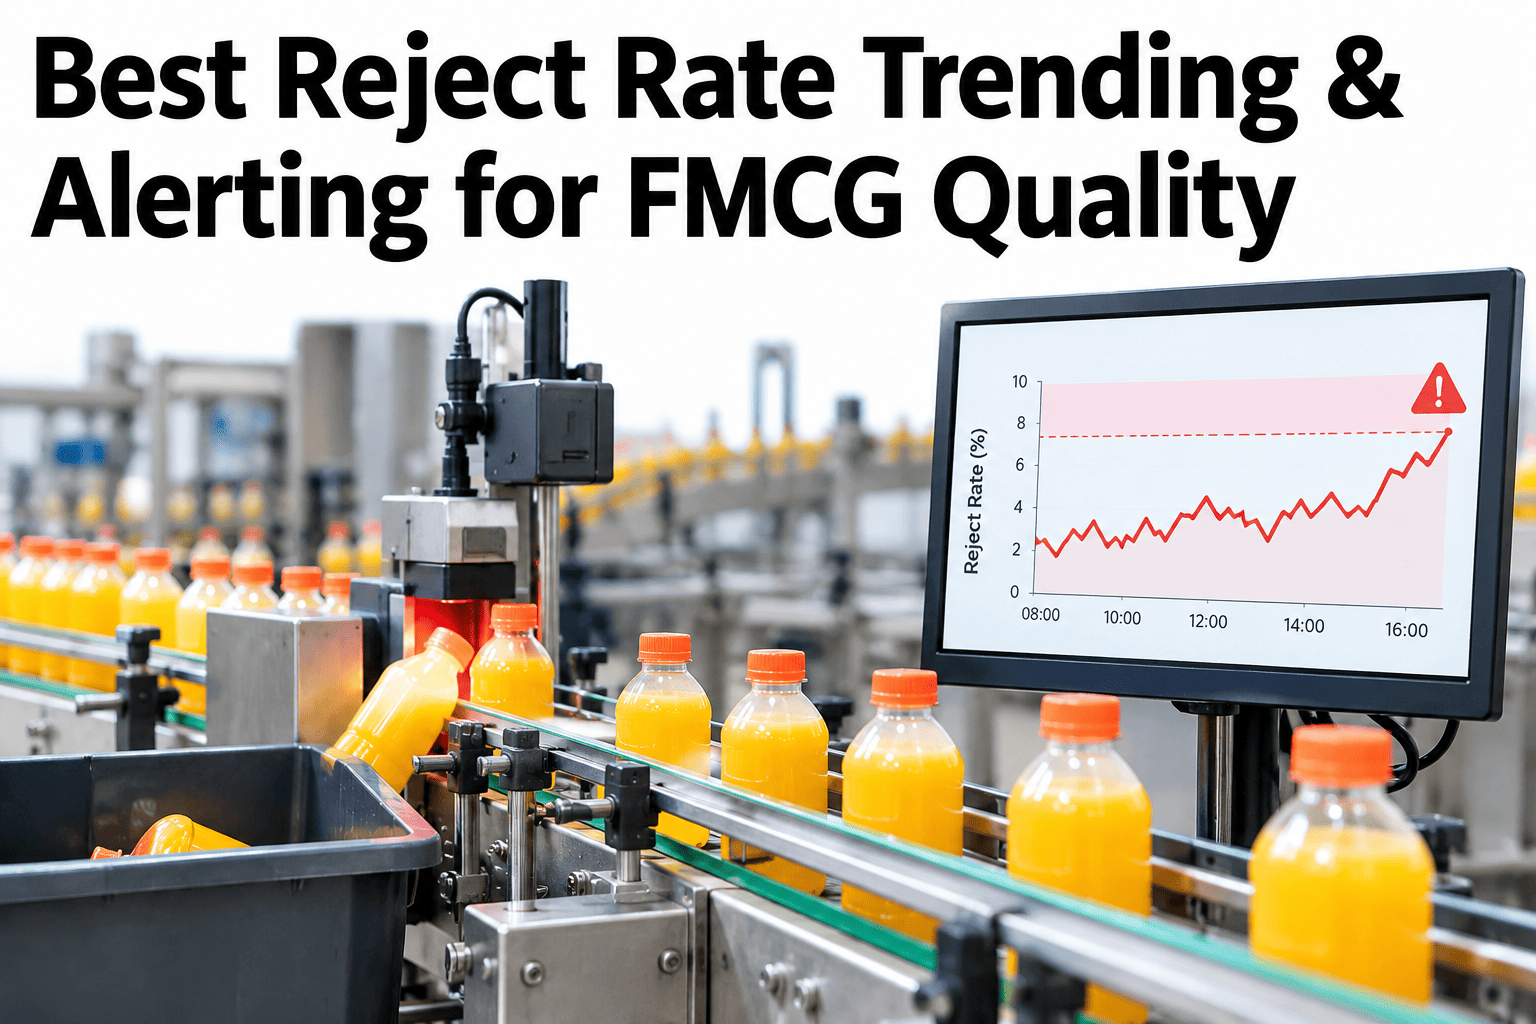
A reject rate that creeps from two percent to four percent over a shift rarely trips a single alarm, because no single reject ever crosses a hard limit. It's the trend that matters, not any one data point, and a quality system built only to flag individual out-of-spec units will let a slow drift run the entire shift before anyone notices the pattern. SPC control limits, rate-of-change alerts and drift detection together catch that creep while there's still time to adjust the process. FMCG quality managers can see reject rate trending flagged before it crosses a shift on iFactory AI against their own line's history.
The Trend Matters More Than Any One Reject
iFactory AI combines SPC control limits, rate-of-change alerts and drift detection to catch a creeping reject rate before it runs the shift.
Three Layers of Detection, Not One
Flags when reject rate moves outside statistically expected variation.
Catches a fast-moving shift even while still inside control limits.
Surfaces a slow, sustained creep that neither of the above would trigger alone.
What Each Method Catches, and What It Misses
| Method | Strong At | Misses |
|---|---|---|
| Fixed threshold alarm | A sudden spike past a hard limit | A slow creep that never crosses the line |
| SPC control chart | Statistically meaningful shifts vs normal noise | A trend too gradual to break control limits quickly |
| Rate-of-change alert | A fast-moving shift, even within limits | A slow drift with a low rate of change |
| Drift detection | Gradual, sustained movement over hours | A sudden one-off spike that resolves quickly |
Check Which Detection Layer Would Have Caught Your Last Drift
Bring a recent reject rate event to a 30-minute session and see which method would have flagged it earliest.
From Alert to Root Cause
Reject rate trend crosses a statistical or rate threshold.
Process parameters from the same window surface automatically.
The parameter that moved with the reject rate is identified.
Process corrected before the shift ends, not after.
A Composite Scenario: The Shift That Ended at Six Percent
Picture a packaging line where reject rate starts the shift at two percent, a normal level, and climbs gradually to six percent by the end. No single hour crosses the plant's fixed reject alarm threshold, so nothing fires.
A drift detection layer watching the trend across the full shift would have flagged the pattern by hour two, giving the team four hours to find and fix the cause instead of discovering it in the next morning's report.
Where iFactory AI Fits
Runs all three layers together
Combines SPC limits, rate-of-change and drift detection in one view.
Pulls the root cause automatically
Surfaces process parameters from the same window as the drift.
Alerts before shift-end
Flags the pattern while there's still time to correct it.
Learns your line's normal
Sets control limits from your own process history, not a generic standard.
Expert Review
A quality engineering perspective, reviewed for accuracy before publication: the most expensive reject rate events I've reviewed almost never involve a sudden spike. They involve a quiet climb that stayed inside every fixed alarm threshold the whole time. Running a drift check against your own reject history usually surfaces at least one event that a trend-based system would have caught hours earlier than it actually was.
Frequently Asked Questions
What's the difference between SPC control limits and a fixed reject rate alarm?
A fixed alarm fires only when reject rate crosses one set number, regardless of the process's normal variation. SPC control limits are calculated from your process's own statistical behavior, so they can flag a shift that's unusual for your line specifically, even if it's still below a generic fixed threshold. See how SPC limits would be set from your own line's history in a short session.
How does drift detection catch something SPC control limits would miss?
Control limits are designed to flag a statistically significant shift, but a very gradual drift can take a long time to accumulate enough change to breach them. Drift detection specifically tracks the sustained direction of movement over a longer window, which can surface a slow trend well before it's large enough to break a control limit. Ask for an explanation of how drift detection would apply to your reject patterns.
How much historical data is needed to set meaningful control limits?
Enough to capture your process's normal range of variation across different conditions, shifts and product runs, which for most FMCG lines means several weeks rather than a few days. Setting limits from too short a window risks either too many false alarms or limits too loose to catch a real problem. Explore how much historical data your line has available to build from.
Can this reduce false alarms compared to our current reject rate alarms?
Statistically grounded control limits, tuned to your process's actual variation, generally produce fewer nuisance alerts than a single fixed threshold applied uniformly, since they account for normal day-to-day noise. The right balance between sensitivity and false alarm rate still needs tuning for your specific line and risk tolerance. Try a review of your current alarm false-positive rate against this approach.
How quickly can root cause be identified once a drift is flagged?
When process parameters are already connected to the same timeline as the reject rate data, the parameter that moved alongside the drift can often be identified within minutes rather than requiring a manual investigation pulling data from separate systems. The specific speed depends on how much process instrumentation is in place. Join a session on root cause speed for your own instrumented parameters.
Catch the Creep Before It Becomes the Whole Shift
iFactory AI trends reject rate across all three detection layers and pulls the root cause automatically. Book a walkthrough on your own line.