Every digital twin vendor will quote you an accuracy number, and almost none of those numbers mean the same thing from one plant to the next. A twin's match rate against reality depends heavily on which asset it's modeling, how much historical and live data feeds it, and what kind of model sits underneath — a physics-based simulation, a machine-learning model, or a hybrid of both. Setting realistic accuracy benchmarks by asset class before a project starts is what separates a twin the operations team actually trusts from one that gets quietly ignored after the first bad prediction. FMCG plants scoping a twin deployment can review realistic accuracy targets for their own asset mix with iFactory AI before committing to a timeline.
Know What Accuracy to Expect Before You Commit to a Twin
iFactory's Digital Twin is calibrated against your live production data, with accuracy targets that vary honestly by asset class, model type, and how much of your data infrastructure is actually connected.
Why "95% Accurate" Is an Incomplete Sentence
Accuracy claims without qualifiers are close to meaningless. The same twin can hit 95% agreement on a well-instrumented filler and struggle to reach 80% on a legacy conveyor with sparse sensor coverage — both numbers can be honestly reported by the same vendor about the same plant. A useful accuracy benchmark always specifies three things: which asset, against which metric, and validated over what period.
A high-speed filler with dense sensor coverage validates very differently than an under-instrumented legacy conveyor on the same line.
Throughput prediction, failure timing, and fill-weight accuracy are three different numbers — a twin can excel at one and lag on another.
A number validated over one clean week reads very differently than one held across a full quarter including changeovers and CIP cycles.
Realistic Accuracy Ranges by Asset Class
Not every station on an FMCG line is equally predictable. Assets with dense sensor coverage and simple, well-understood physics land at the top of the range; assets with sparse instrumentation or highly variable inputs sit lower — and that's expected, not a sign of a broken model.
A plant reporting a single blended accuracy number across every asset class is hiding exactly the variation that matters — the legacy conveyor's 76% is diluted by the filler's 92%, and the resulting average tells you nothing about where the twin can actually be trusted for a decision.
Get an Asset-by-Asset Accuracy Estimate for Your Line
Book a 30-minute session and iFactory AI will walk through your current sensor coverage, asset mix, and data maturity to set realistic per-asset accuracy targets.
Three Model Types, Three Different Accuracy Profiles
The kind of model underneath a twin shapes both its accuracy ceiling and how it fails. Knowing which type is doing the work changes what a validation report should actually be checked against.
First-Principles Simulation
Built from known engineering relationships — fluid dynamics, thermal transfer, mechanical constraints. Highly accurate within the conditions it was designed for, and it degrades predictably outside them rather than failing silently.
Data-Driven Residual Models
Learns patterns directly from historical and live sensor data. Can capture behavior too complex to model from first principles, but accuracy depends entirely on how representative the training data is of real operating conditions.
Physics Plus ML Residual
A deterministic physics or discrete-event core handles the well-understood dynamics, while an ML layer fitted on shift-level history corrects for what the physics model alone misses — combining predictable degradation with learned nuance.
The Data Maturity Curve
Accuracy isn't fixed at go-live — it climbs as more data sources connect and the model calibrates against a longer production history. Most deployments achieve meaningful intelligence well before every possible data source is connected, but the ceiling keeps rising as coverage grows.
How to Actually Measure Twin Accuracy
A single "percent accurate" figure invites gaming. Rigorous digital twin validation studies use several distinct metrics together, each catching a different kind of error a single number would hide.
| Metric | What It Measures | What It Catches |
|---|---|---|
| MAPE | Mean absolute percentage error between predicted and actual values | Overall prediction error as a readable percentage |
| RMSE | Root mean squared error, penalizing larger deviations more heavily | Occasional large misses a simple average would hide |
| R² (Coefficient of Determination) | How well the model's predictions track the pattern of real variation | Whether the model captures the shape of behavior, not just the average |
| Statistical Significance Testing | Whether the twin's KPI outputs differ meaningfully from the real line's | False confidence from a model that only looks close by chance |
A twin validated against a published academic benchmark achieved an R² of 0.94 between predicted and measured values on a physics-informed vibration model — a useful reminder that even well-validated twins report agreement in the low-to-mid 90s, not a flat 100%.
Twin Versus Reality: Reading the Divergence
Accuracy isn't just a launch-day number — the more useful signal is what happens when the twin and the real line start to disagree after weeks or months of running together. That gap, tracked over time, is often more informative than the headline accuracy figure itself.
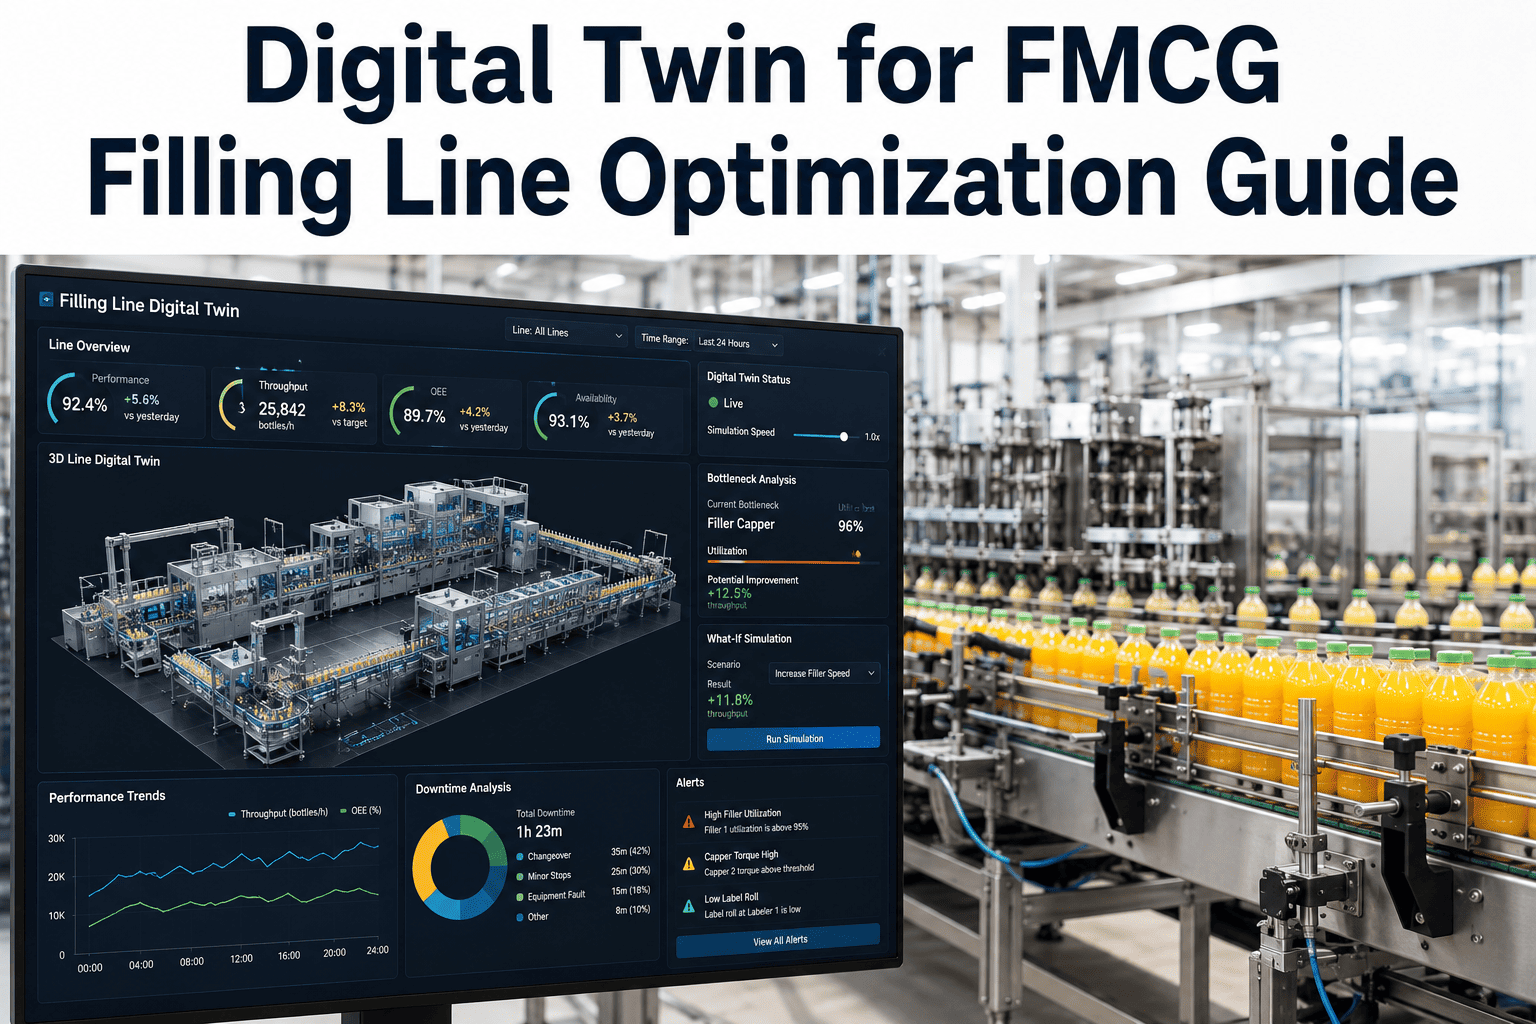
When the actual line begins to deviate from the twin's expected behavior, that divergence is itself a diagnostic signal — the dashboard can alert the team with the specific parameter that is drifting and the estimated performance impact if it's left uncorrected, turning an accuracy gap into an early-warning tool rather than just a validation failure.
A Composite Scenario: The Accuracy Number That Was Technically True and Practically Useless
A beverage plant evaluating a digital twin vendor was quoted a single headline figure — "95% accurate" — applied to the whole production line as one blended number, with no breakdown by asset or metric offered upfront.
Once the plant asked for a per-asset breakdown, the picture looked different. The filler and capper stations, both densely instrumented, were genuinely running in the low-to-mid 90s on throughput prediction. A retrofit conveyor section with only two added sensors was validating closer to 74% on the same metric, and the blended 95% figure had been calculated by weighting the well-instrumented stations more heavily in the sample. Rebuilding the validation report with an honest per-asset breakdown didn't change the underlying model — it changed what decisions the plant was willing to trust the twin for, restricting automated what-if scenarios on the conveyor section until additional sensors closed the coverage gap.
Questions to Ask Before Trusting an Accuracy Claim
Is the number broken down by asset, or blended across the whole line?
A single line-wide figure almost always averages over real variation between well-instrumented and sparsely instrumented assets, hiding exactly the information needed to know where the twin can be trusted.
Which metric is the accuracy figure measuring?
Throughput prediction, failure timing, and fill-weight accuracy are genuinely different numbers, and a strong score on one doesn't guarantee a strong score on another.
Over what time period and production conditions was it validated?
A number held across a full quarter including changeovers, CIP cycles, and product-mix shifts is a far stronger claim than one measured over a single clean week.
Does the model retrain on your plant's own data, or a generic industry baseline?
Accuracy figures built from your specific equipment signature and failure history are a fundamentally different claim than the same number borrowed from an industry average.
iFactory's Digital Twin connects to the sensors, historian, and ERP you already have, calibrates against your specific equipment signature, and reports accuracy honestly by asset class rather than one blended figure. The twin's dashboard flags divergence from expected behavior as it happens, so a drifting accuracy number is caught early instead of discovered in a quarterly review.
Frequently Asked Questions
What accuracy should we realistically expect from a digital twin on our line?
It depends heavily on the asset. Well-instrumented, physically well-understood stations like fillers and cappers typically land in the 88–95% range on throughput and performance prediction, while under-instrumented legacy equipment often sits in the low-to-mid 70s until additional sensor coverage is added. A single blended number across the whole line will always sit somewhere between these extremes and hides which parts of the twin can actually be trusted for automated decisions. iFactory AI's team can review your specific sensor coverage and give you an honest asset-by-asset estimate before you commit to a project.
Does a physics-based or machine-learning model give better accuracy?
Neither is categorically better — they have different accuracy profiles and different failure modes. Physics-based models are highly accurate within the operating conditions they were designed for and degrade predictably outside those conditions, while machine-learning models can capture complex behavior that's hard to derive from first principles but depend entirely on how representative their training data is. Hybrid approaches, pairing a deterministic physics core with an ML residual layer, are increasingly common specifically because they combine the predictability of physics with the nuance ML can add on top.
How long does it take for twin accuracy to reach its full potential?
Most deployments connect 60–80% of available data sources at initial launch, which is enough for meaningful intelligence but not the model's ceiling. Accuracy typically climbs over the following weeks as models calibrate against the plant's specific equipment signature, with failure prediction accuracy above 90% achievable once the model has several months of production history to learn from. This is a gradual maturity curve rather than a single go-live accuracy figure that stays fixed. Book a demo to see how iFactory AI's accuracy has progressed on comparable FMCG deployments.
What does it mean when the twin and the real line start disagreeing?
Divergence between a twin's predictions and actual line behavior is itself a useful signal, not just a validation failure — it can indicate equipment wear, calibration drift, or an unmodeled configuration change. A well-built twin dashboard surfaces the specific parameter that's diverging and the estimated performance impact if it's left uncorrected, turning a growing accuracy gap into an early-warning tool that points engineers directly at the cause rather than requiring a full re-audit to find it.
How should we evaluate a vendor's accuracy claims during procurement?
Ask for the claim broken down by asset class rather than accepting a single line-wide figure, ask which specific metric it measures — throughput, failure timing, and fill-weight accuracy are genuinely different numbers — and ask what time period and production conditions it was validated over. A number held across a full quarter including changeovers and CIP cycles is a meaningfully stronger claim than one measured over a single clean week, and a vendor willing to share the breakdown rather than just the headline number is generally the more trustworthy one to work with.
Set Accuracy Benchmarks You Can Actually Trust
iFactory's Digital Twin reports accuracy honestly by asset class, calibrates against your own production history, and flags divergence from expected behavior as it happens. Book a walkthrough to see realistic accuracy targets for your specific line.