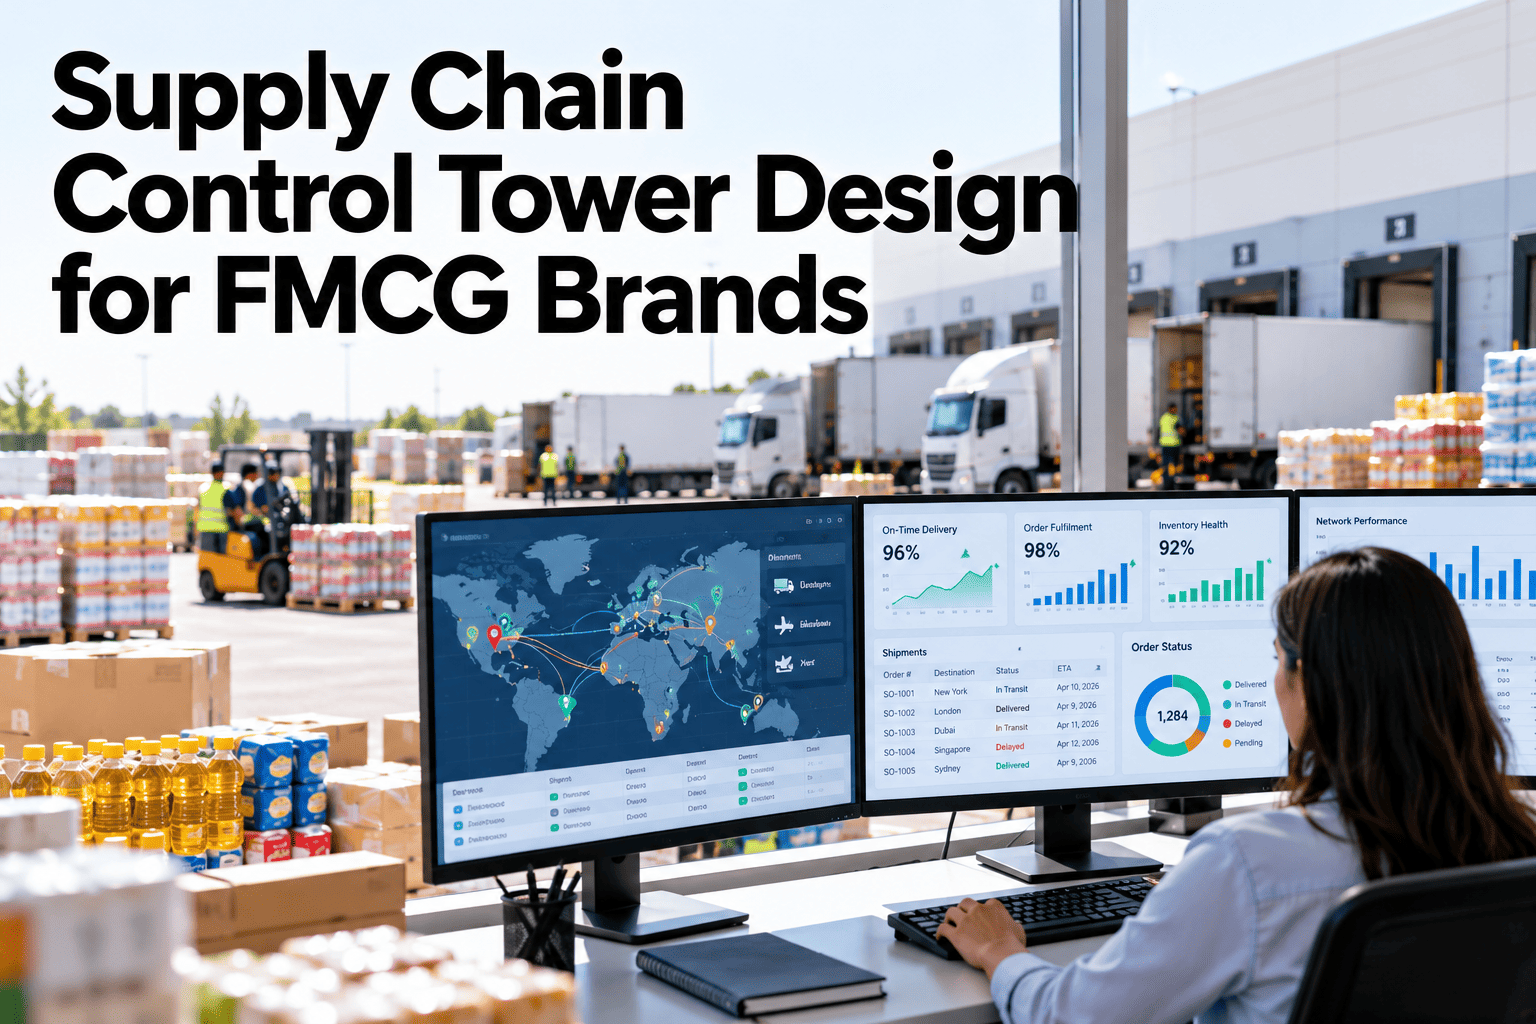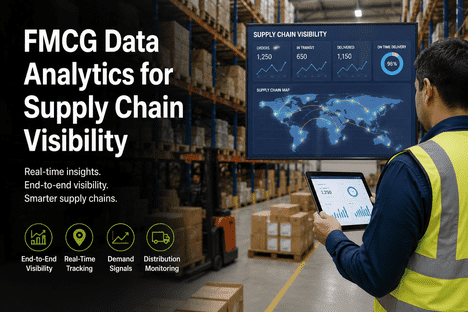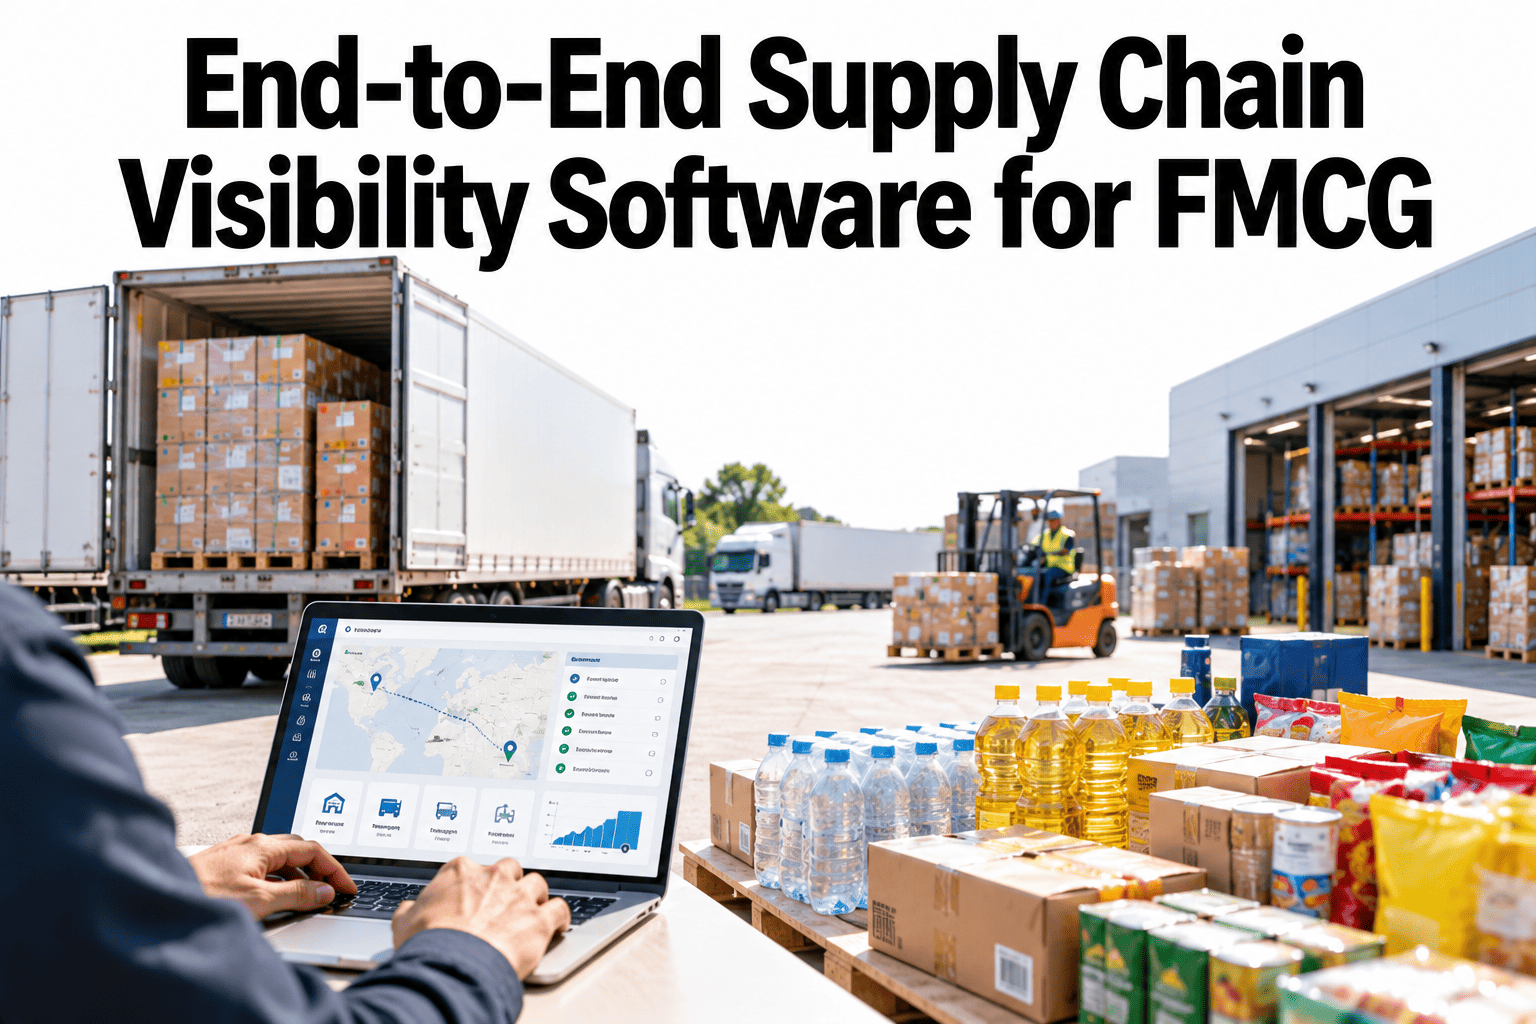
Ask most FMCG supply chain teams where a specific order stands right now, and the honest answer takes four phone calls and two system logins to assemble. Suppliers, plants, warehouses and distributors each run their own systems, each accurate for their own slice of the chain and blind to everything outside it. A control tower does not replace those systems, it sits above them and joins the pieces so a disruption anywhere in the chain is visible before it reaches the customer, not after. Supply chain leaders can see how iFactory AI connects upstream and downstream data into one view before the next disruption hits blind.
End-to-End Supply Chain Visibility Software for FMCG
See suppliers, plants, warehouses and distributors on one timeline, so a problem upstream is visible long before it reaches a customer.
What "Visibility" Actually Means Here
The word gets used loosely. A useful definition separates seeing data from being able to act on it.
You can look up where things stand when you ask, after someone notices a problem.
The system flags a developing disruption before anyone had to go looking for it.
The flag comes with enough context to decide what to do, not just that something is wrong.
Most supply chains have reactive visibility within each system and none across them. A control tower's job is to close that gap, not just add another dashboard.
Four Layers a Control Tower Needs to Connect
Each layer speaks its own operational language. Joining them means translating, not just piping raw data into one screen.
| Layer | Typical Data | Connection Challenge |
|---|---|---|
| Suppliers | Purchase orders, confirmed ship dates, inbound quality | Data quality and update frequency vary by supplier |
| Plants | Production schedules, output, downtime | Each plant may run a different MES or none at all |
| Warehouses | Inventory levels, inbound and outbound movement | WMS platforms differ across regions and 3PL partners |
| Distributors | Sell-through, stock levels, replenishment orders | Visibility often stops at the first tier of distribution |
See Which of These Layers You Can Connect First
Book a 30-minute session and iFactory AI will review your current systems and show a realistic sequence for connecting suppliers, plants, warehouses and distributors.
From Disruption to Decision, in One Flow
The value of a control tower shows up in how fast a disruption travels from first sign to a decided response.
Signal appears
A supplier confirms a delay, a plant reports downtime, or demand shifts unexpectedly.
Impact assessed
The system traces which downstream orders or customers the signal will affect.
Options surfaced
Alternate suppliers, plants or inventory sources are shown as candidates.
Decision made
A planner acts with full context, instead of discovering the disruption after it lands.
Reactive Firefighting Versus a Control Tower
The practical difference is not the software, it is how early the team finds out something has gone wrong.
Where to Start, Realistically
Connecting the whole chain at once is rarely practical. A phased approach gets value sooner and surfaces integration issues early.
Connect the layers with the most reliable existing data, often plants and warehouses.
Extend to key suppliers and first-tier distributors with the highest disruption risk.
Widen coverage and add proactive alerting as data quality and trust build.
The control towers that deliver real value are built in phases around the data that is already reliable, not launched as a single big-bang project connecting every system at once. Trying to onboard every supplier, every plant and every distributor simultaneously usually means the weakest data source sets the pace for the whole programme, and trust in the tower erodes quickly if early alerts turn out to be based on stale or incomplete feeds. Start with the two or three layers where data is already solid, prove the value of proactive visibility there, and let that success fund the harder integration work further out in the chain.
Where iFactory AI Fits
iFactory AI joins supplier, plant, warehouse and distributor data into one timeline, so disruptions are visible upstream before they reach the customer.
One chain, one timeline
Data from across the chain is normalised and shown together, not left in separate dashboards.
Proactive disruption flags
A developing issue is flagged with its likely downstream impact, before a customer notices.
Phased connection
Layers are connected in a sequence matched to your current data reliability, not all at once.
Ask in plain language
Ask which orders are at risk from a supplier delay today and receive a direct answer.
Frequently Asked Questions
What does end-to-end supply chain visibility actually require?
It requires connecting data from suppliers, plants, warehouses and distributors into one consistent view, with enough context attached to each signal that a planner can act on it rather than just see it. Seeing the data alone, without impact context, only gets you reactive visibility. You can watch a sample chain connected and traced in a live session.
Do we need to connect every supplier and distributor at once?
No, and trying to is usually counterproductive. Start with the layers where data is already reliable, prove the value there, and extend to higher-risk suppliers and distributors in later phases. To plan this sequence, request a phased integration review with the iFactory AI team, or ask support what systems are supported.
How is this different from the dashboards we already have?
Most existing dashboards show one layer of the chain in isolation. A control tower traces how a signal in one layer, such as a supplier delay, affects downstream layers, which a single-layer dashboard cannot do on its own. A short product tour of impact tracing shows how this connects across layers.
How accurate does supplier data need to be for this to work?
Accuracy matters more than completeness at first. A smaller set of reliable supplier feeds is more useful than a wide set of inconsistent ones, since unreliable data undermines trust in the whole system faster than missing data does. See how data quality is assessed before onboarding a source in a guided walkthrough.
How long does it take to see value from a control tower project?
A phased rollout can show value from the first connected layers within weeks, while full chain coverage with proactive alerting across suppliers and distributors typically builds over a longer period as trust and data quality grow. Schedule a walkthrough of a realistic rollout timeline for your own chain.
Stop Finding Out About Disruptions From Customers
iFactory AI connects your supply chain into one view, so disruptions are visible before they reach the customer. Book a walkthrough to see it built around your own network.