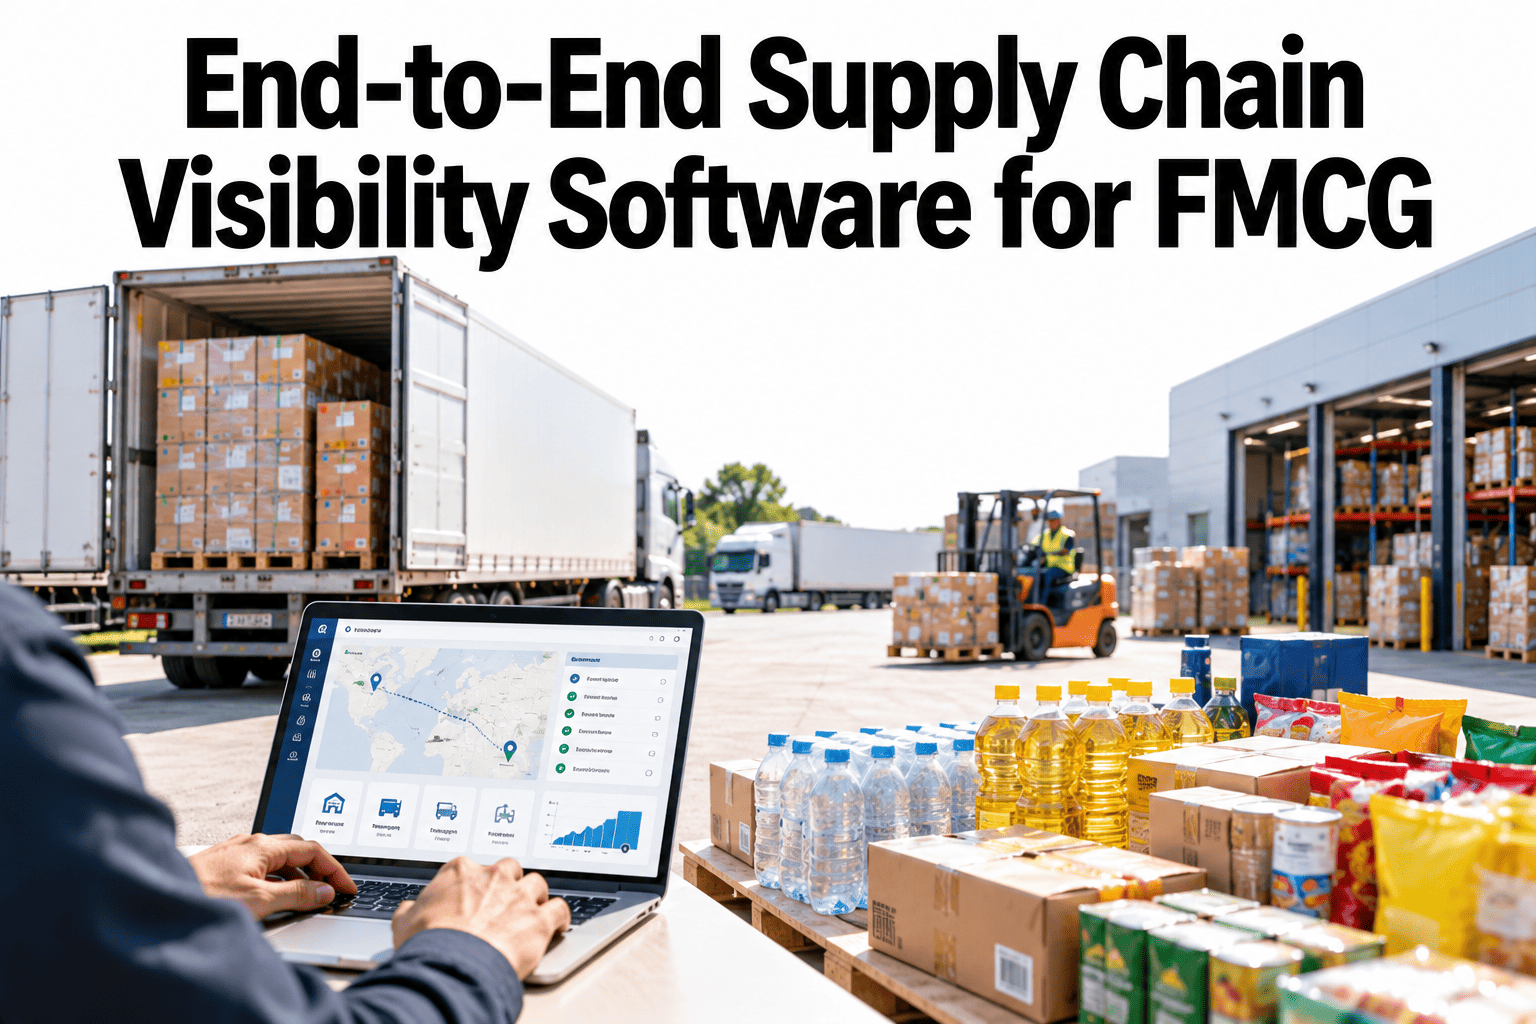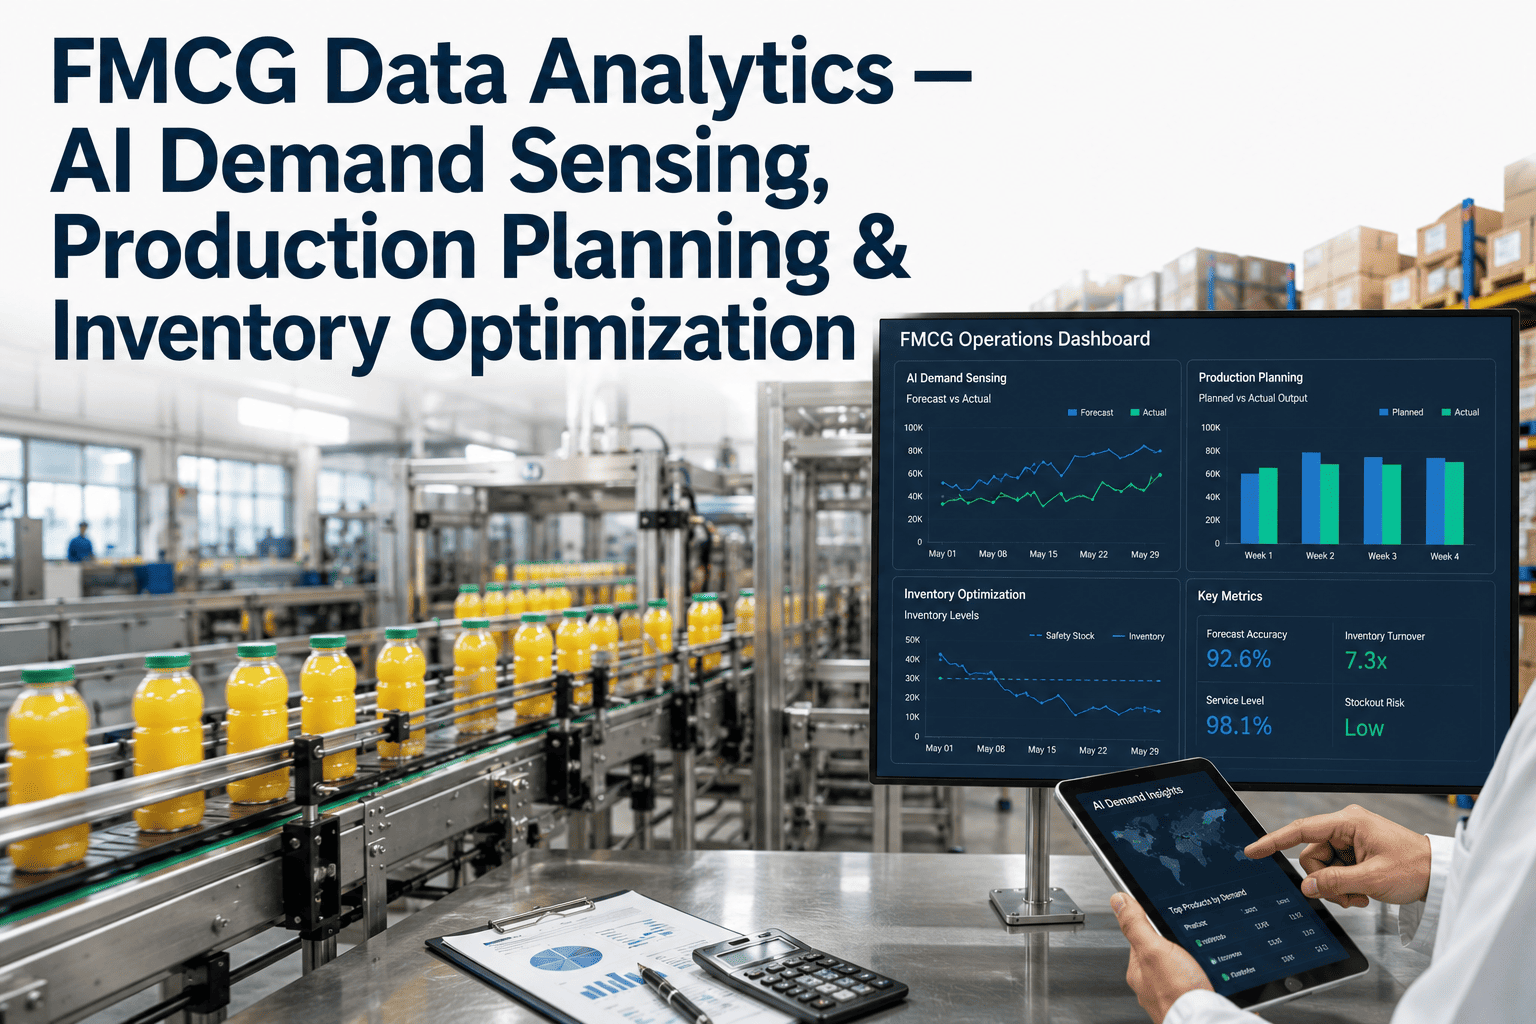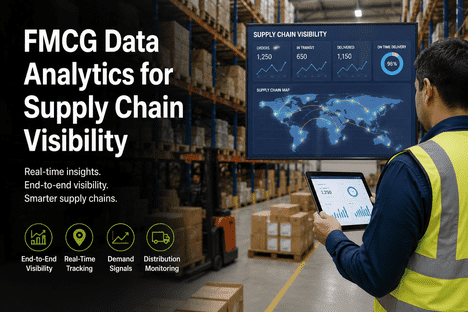
The supply chain director opens the weekly performance dashboard and sees the familiar pattern: production output at the primary facility was 94% of plan, the regional distribution centre received 89% of the ordered volume, and two retail customers reported stock-outs on three SKUs that were showing as available in the warehouse management system. The disconnect between what the data says and what the market experiences is the defining challenge of FMCG supply chain management. Each node in the chain — raw material supply, production, warehousing, distribution, retail — generates its own data, but the data lives in separate systems with separate timestamps, separate units of measure, and separate definitions of availability. Analytics bridges these disconnected data islands by ingesting signals from every node, normalising them into a unified time-series data model, and presenting the supply chain as a single system rather than a collection of independent functions. For FMCG supply chain leaders, the value is not in having more data. It is in having the right data connected across the chain, transforming fragmented operational signals into end-to-end visibility that exposes constraints before they become stock-outs and inventory imbalances before they become write-offs.
Ready to Connect Your FMCG Supply Chain Data Into a Single Visibility Platform?
iFactory integrates production, warehouse, distribution, and demand data into a unified analytics platform — delivering real-time supply chain visibility, constraint detection, and automated alerting across every node in your FMCG network.
What Data Analytics Means for FMCG Supply Chain Visibility
Data analytics transforms FMCG supply chain visibility from a retrospective reporting function into a real-time decision support system. Traditional supply chain visibility tools aggregate data from each node independently — production output from the MES, inventory levels from the WMS, shipments from the TMS — and present them in separate dashboards that require manual reconciliation to understand the end-to-end picture. Analytics-driven visibility ingests data from every node into a unified data model that maintains the relationships between production batches, inventory movements, and customer orders, enabling questions that traditional reporting cannot answer: which production delays will cause a specific customer stock-out three weeks from now, which inventory position is most at risk from a supplier disruption, and which distribution route has the highest probability of delay based on current conditions. Book a Demo to see how iFactory connects production, warehouse, and distribution data into a single supply chain visibility platform.
| Visibility Capability | Traditional Reporting | Analytics-Driven (iFactory) | Impact on FMCG Supply Chain |
|---|---|---|---|
| Data Integration | Monthly manual exports from each system | Real-time ingestion from MES, WMS, TMS, and ERP via pre-built connectors | End-to-end visibility updated every 15 minutes instead of monthly |
| Constraint Detection | Reactive — identified after stock-out occurs | Predictive — AI models forecast bottlenecks 7-14 days in advance | Proactive intervention before stock-out, not after |
| Demand-Supply Matching | Static safety stock rules per SKU | Dynamic ATP with real-time demand signal integration | 5-8% improvement in order fill rate at same inventory level |
| Alerting & Escalation | Email alerts based on fixed thresholds | AI-powered anomaly detection with contextual escalation | 80% reduction in false alerts; alerts reach the right person automatically |
| Root Cause Analysis | Manual investigation across multiple systems | Automated traceability from customer stock-out to production event | Root cause identified in minutes instead of days |
| Collaboration | Email and spreadsheets between functions | Shared visibility dashboard with role-based views | Cross-functional decisions based on the same data |
Six Analytics Capabilities for End-to-End FMCG Supply Chain Visibility
Real-Time Production Visibility
Connect every production line, packing line, and processing unit to a unified dashboard that displays output against plan, quality status, and projected completion time by SKU. iFactory ingests data from PLCs, MES, and manual entry terminals to provide a single source of truth for production status across all facilities.
Warehouse Inventory Intelligence
Consolidate inventory data from every warehouse, DC, and forward stock location into a single view with real-time stock levels, age profiling, and projection of stock-out dates by SKU. iFactory identifies slow-moving inventory, approaching expiry, and replenishment requirements automatically.
Distribution & Logistics Tracking
Track shipments from dispatch to delivery with real-time location data, estimated time of arrival, and delay prediction. iFactory integrates with TMS platforms, GPS telematics, and carrier APIs to provide end-to-visibility of every shipment across your distribution network.
Demand Signal Integration
Ingest demand signals from customer orders, retail POS data, and distributor forecasts to create a unified demand picture. iFactory's AI models reconcile conflicting demand signals and generate a consensus forecast that drives production scheduling and inventory deployment.
Constraint & Bottleneck Detection
AI models analyse the entire supply chain in real time to identify the constraint that will limit throughput or service levels next. Whether the bottleneck is a production line, a warehouse dock, or a carrier capacity, iFactory identifies it and recommends the corrective action.
Automated Alerting & Escalation
When a deviation occurs — production behind schedule, inventory below safety stock, shipment delayed — iFactory sends a contextual alert to the right person with the relevant data attached. Escalation rules ensure that unresolved issues reach the appropriate level of management automatically.
Deploying End-to-End Supply Chain Visibility Across Your FMCG Network
Transitioning from fragmented, system-by-system reporting to unified analytics-driven visibility requires a structured deployment approach that connects each node in the supply chain incrementally. iFactory's deployment methodology has been refined across multiple FMCG networks and delivers production-ready supply chain visibility within weeks, not months.
Map Your Supply Chain Data Landscape
iFactory's deployment team conducts a data audit across your MES, WMS, TMS, ERP, and demand planning systems — identifying data availability, quality, and latency at each node. The audit produces a data connectivity map that shows which systems can be connected immediately and which require data quality remediation before integration.
Connect Production and Warehouse Data
Pre-built connectors integrate your production lines and warehouse management systems into the iFactory platform. PLC data from filling lines, packing lines, and processing units is ingested alongside WMS inventory data to create the first connected view of production-to-warehouse flow.
Integrate Distribution and Demand Data
TMS, carrier API, and GPS telemetry data is added to extend visibility from warehouse dispatch to customer delivery. Demand signals from customer orders, POS data, and distributor forecasts are integrated to create the end-to-end picture from demand through production to delivery.
Deploy Dashboards, Alerts, and AI Models
Role-based dashboards are configured for supply chain planners, production managers, logistics coordinators, and executives. AI constraint detection models are trained on historical data and deployed in shadow mode for validation before live activation. Automated alerts are configured with escalation rules.
Validate, Optimise, and Scale
Parallel validation compares AI constraint predictions against actual outcomes to confirm model accuracy. After validation, the platform is scaled across additional facilities and nodes, with the data model expanding to cover the full network incrementally.
Industry Expert Perspective on FMCG Supply Chain Analytics
"The FMCG supply chains I have worked with over the past 20 years are drowning in data but starving for visibility. Each function has its own systems, its own reports, and its own version of the truth. The companies that solve this problem first will have a structural advantage that their competitors will struggle to match."
Measurable ROI — What Supply Chain Visibility Delivers for FMCG
The financial case for analytics-driven supply chain visibility is built from measurable improvements across four categories that directly impact profitability and service levels.
Service Level Improvement
- Order fill rate increased from 94% to 98.5% through real-time constraint detection
- Customer stock-out events reduced by 60% within 90 days of deployment
- Response time to supply chain disruptions reduced from days to minutes
- Automated alerting ensures critical issues reach decision-makers immediately
Inventory Optimisation
- Safety stock reduced by 15-20% through improved demand-supply visibility
- Excess and slow-moving inventory identified and actioned 70% faster
- Write-offs reduced by 35% through early detection of approaching expiry
- Working capital freed through optimised inventory deployment across network
Operational Efficiency
- Planning team hours reduced by 50% through automated data consolidation
- Cross-functional meeting time reduced by 30% with shared visibility dashboards
- Manual reporting eliminated across supply chain, saving 40 person-hours weekly
- Root cause analysis time reduced from 2 days to 15 minutes
Conclusion — Analytics Is the Foundation for FMCG Supply Chain Visibility
FMCG supply chain leaders evaluating analytics platforms face a critical decision: continue operating with disconnected data across production, warehouse, distribution, and demand systems, or deploy a unified visibility layer that connects every node into a single operating picture. The decision carries real financial consequences — service levels, inventory efficiency, working capital, and cross-functional productivity all depend on the quality and timeliness of the data that connects the chain. iFactory provides the integration layer, analytics engine, and AI-powered constraint detection that transforms fragmented operational data into end-to-end supply chain visibility.
Deploy Supply Chain Visibility Across Your FMCG Network with iFactory
iFactory delivers production-ready end-to-end supply chain visibility for FMCG manufacturers and distributors — connecting production, warehouse, distribution, and demand data into a single analytics platform with AI-powered constraint detection and automated alerting built for continuous operation.
FMCG Supply Chain Visibility — Frequently Asked Questions
How does iFactory connect to our existing MES, WMS, and ERP systems?
iFactory provides pre-built connectors for 40+ industrial and enterprise platforms including SAP, Oracle, Microsoft Dynamics, Blue Yonder, Manhattan, and all major MES and SCADA systems. Data ingestion is handled through API integration, database view access, or flat file import depending on your system architecture and security requirements. No system replacement or modification is required. The platform reads data from each source system and normalises it into a unified time-series data model that maintains the relationships between production batches, inventory movements, and customer orders.
How long does it take to deploy end-to-end supply chain visibility across a multi-site FMCG network?
A standard deployment across three to five facilities covering production, warehouse, and distribution takes 60 to 90 days from initial system connectivity assessment to live dashboards with AI constraint detection. The timeline includes data source integration across all nodes, data quality validation and normalisation, dashboard configuration for each role, AI model training and validation, and user training. An express pilot covering one facility and its downstream DC can be operational in 30 days for evaluation purposes before full network rollout.
What level of data quality is required before iFactory can deliver useful supply chain visibility?
iFactory's data pipeline includes automated data quality checks that identify and flag issues such as missing timestamps, inconsistent units of measure, and outlier values. The platform can begin delivering value with data quality levels as low as 70% completeness, with the data quality score improving as source systems are remediated. The initial deployment phase includes a data quality audit that identifies the specific issues in each source system, and the dashboard includes a data quality scorecard that tracks improvement over time.
How does iFactory handle data security and access control across different supply chain partners?
iFactory provides role-based access control with granular permission settings at the data source, facility, SKU, and user level. Supply chain partners — contract manufacturers, third-party logistics providers, and distributors — can be granted limited visibility to only the data relevant to their role. All data in transit is encrypted using TLS 1.3, and data at rest is encrypted using AES-256. On-premise deployment options are available for companies with strict data residency or IP protection requirements.
What is the typical ROI timeline for supply chain visibility analytics in FMCG operations?
Industry benchmarks from iFactory deployments across FMCG supply chains show an average payback period of 5.8 months. ROI is driven by three primary levers: service level improvement and stock-out reduction (typically 45-55% of total savings), inventory optimisation and working capital reduction (25-30%), and operational efficiency gains from reduced manual reporting and faster decision-making (15-20%). A typical FMCG supply chain with $200 million in annual revenue and a 94% order fill rate achieves $4-7 million in annual value through combined service level improvement, inventory reduction, and efficiency gains.
Start Your FMCG Supply Chain Visibility Pilot with iFactory Today
FMCG manufacturers and distributors worldwide are deploying iFactory's end-to-end supply chain visibility platform to connect production, warehouse, and distribution data into a single operating picture — with AI-powered constraint detection and automated alerting built for continuous operation.