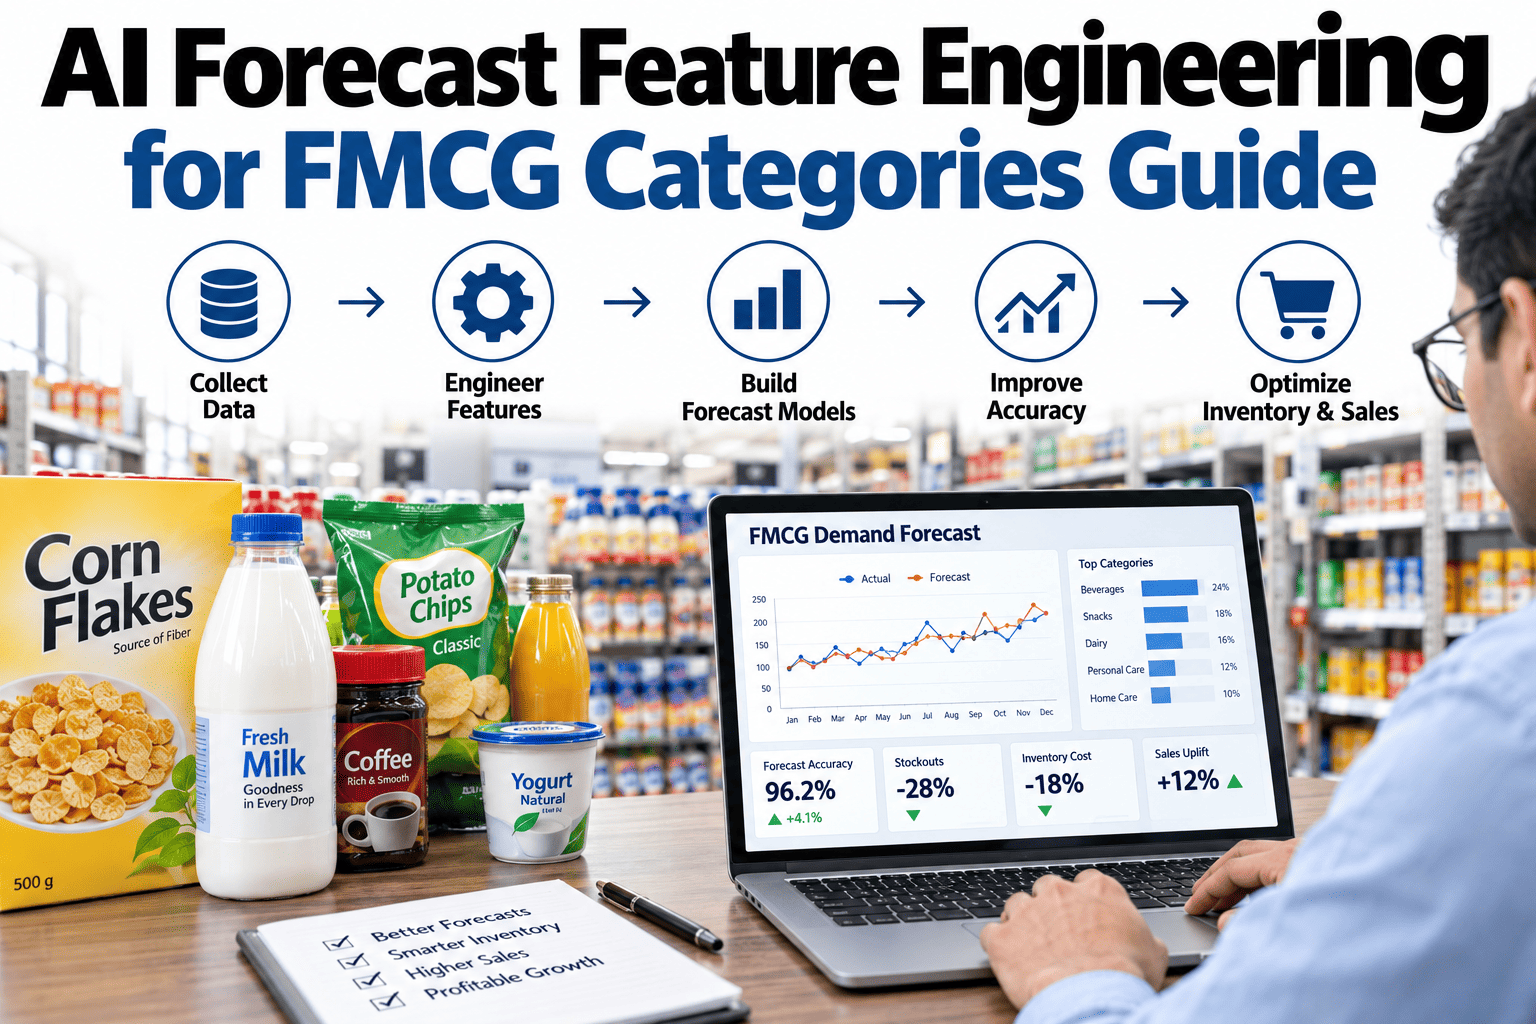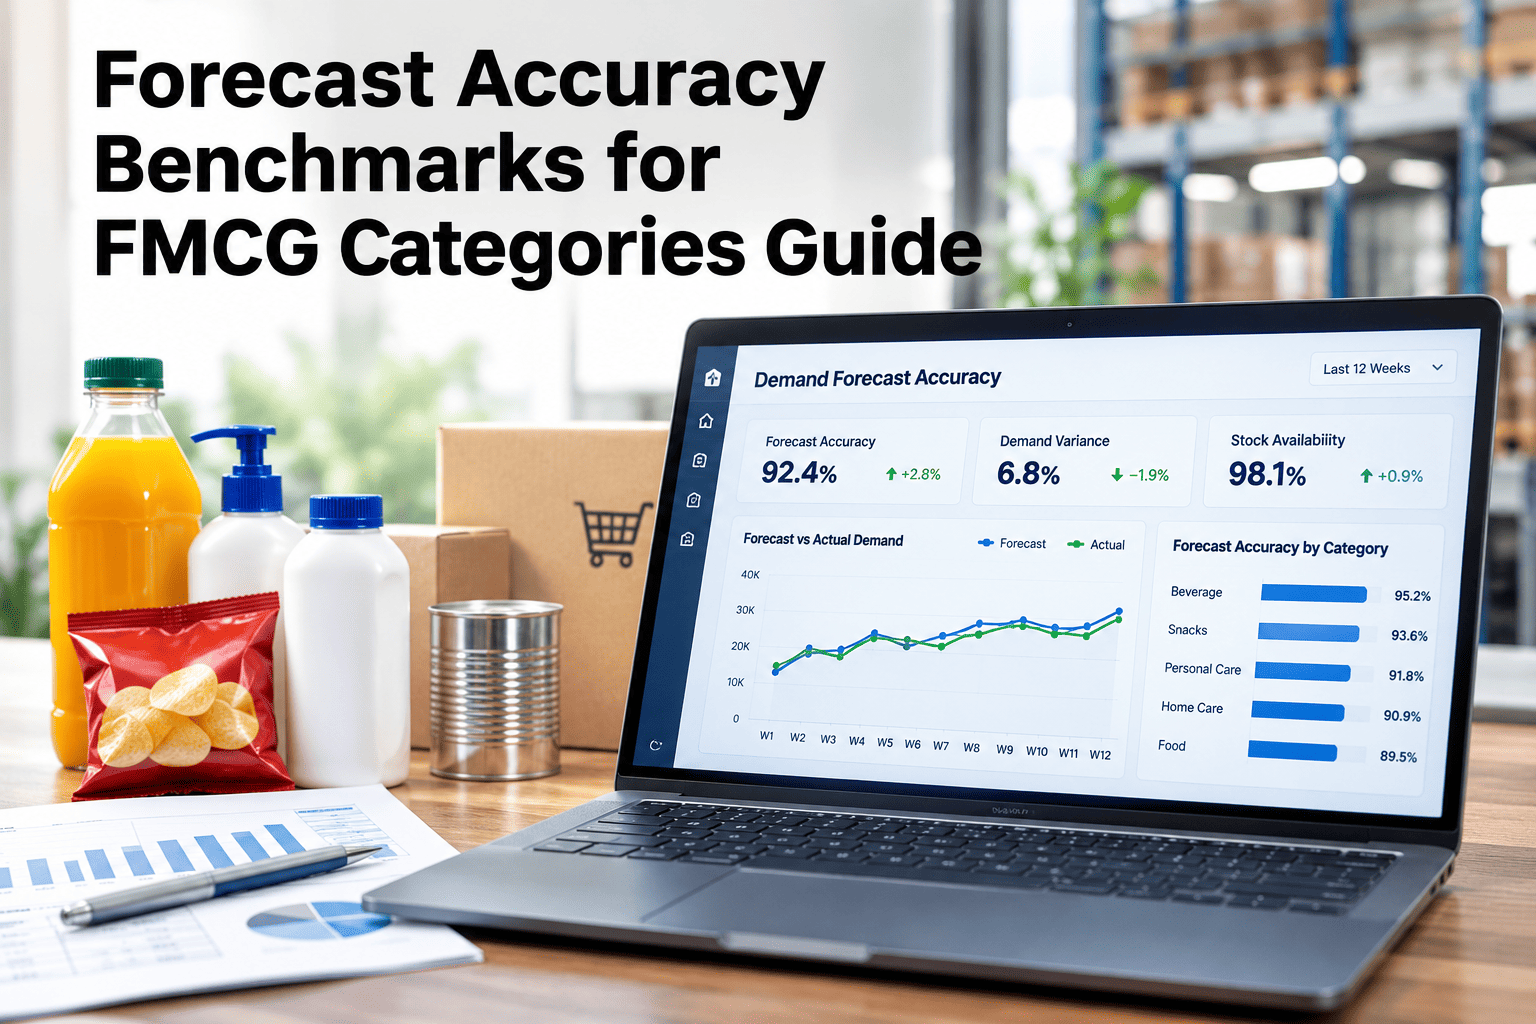
Realistic FMCG forecast error depends more on the level of detail measured than on the category. Published surveys put one-month SKU-level error near 26 to 27 percent in consumer products and in food and beverage, while one practitioner guide places promoted CPG family-level weighted error (WAPE) at 12 to 20 percent, against 25 to 40 percent at SKU level. No reliable public benchmark splits beverage, snack, personal care and household, so each brand should build its own from its own history. Planners can build a benchmark from their own forecast history in a short session.
What a Good Forecast Error Looks Like Depends on the Level You Measure
iFactory AI, an on-premise industrial AI platform, reports error and bias by level, region and horizon, so the number you quote matches the decision you make.
What Counts as Good Forecast Accuracy in FMCG?
There is no single good number. Accuracy improves as sales are aggregated, so forecasts are better at the aggregate level than at category level, and better at category level than at SKU level (Foresight, 2011). Three published figures set the frame.
How Are MAPE, WAPE and Bias Calculated?
Choose the metric to match the question. MAPE treats every item equally, while WAPE weights by volume, so a few slow SKUs cannot dominate the score (scmtips).
Why Does Aggregation Change the Answer?
Random noise averages out as more items are combined, so every aggregate looks better than its parts. Teams can ask for a multi-level accuracy template to measure all levels at once.
| Level | Published Reference | Source | Best Used For |
|---|---|---|---|
| SKU, one month ahead | About 26–27% error | Foresight, 2011 | Replenishment and production |
| SKU, promoted CPG | 25–40% WAPE | Umbrex | Promotion planning |
| Product family, promoted CPG | 12–20% WAPE | Umbrex | Capacity and S&OP |
| Aggregate | Lowest error of all levels | Foresight, 2011 | Budget and target setting |
See Your Own Error at Every Level, Not Just the Flattering One
Share SKU, region and week history. iFactory AI's team will score error and bias at each level and show where your forecast stands.
How Do Beverage, Snack, Personal Care and Household Differ?
No public benchmark gives clean error figures for each of these. The comparison below is a qualitative expectation, not a measured benchmark.
Which Grain and Horizon Should You Benchmark?
Define one base grain, usually SKU by location by week, compute errors there, then roll up with clear weights (Fitgap). A forecast is only comparable at the same lead time.
How Do You Build Your Own Benchmark?
Five steps give a benchmark you can defend. Teams can walk through a benchmark build with iFactory AI's team.
How Should You Read a Vendor Accuracy Claim?
A claim such as 90 percent accuracy means little without its level and baseline. Ask to see the forecast value added against a naive benchmark, at SKU by location by week, with bias by hierarchy.
What Should a Monthly Accuracy Review Cover?
A short, fixed agenda turns scores into action. Teams can request a monthly review template to adapt to their calendar.
Where Does iFactory AI Fit in Accuracy Benchmarking?
iFactory, an on-premise AI platform for manufacturing, measures its forecasts with the same discipline it recommends, and applies it to your own data.
Multi-Level Scoring
WAPE and bias at SKU, family, region and total.
Naive Baselines
Every score is shown against a simple reference.
Segment Targets
Targets are set by ABC and XYZ class, not one flat number.
Value-Added Tracking
Shows whether each step in the process improved the forecast.
Expert Review: Judging a Forecast Accuracy Benchmark
Frequently Asked Questions
What is a good MAPE for FMCG forecasting?
It depends on the level. Published surveys show about 26 to 27 percent one-month SKU error in consumer products and food and beverage, with lower error at category and aggregate levels (Foresight, 2011). Set a target for your own SKUs with our team.
Is WAPE better than MAPE for FMCG?
Often yes. WAPE weights errors by volume, so low-volume items do not dominate, while MAPE treats every item equally and breaks down near zero actuals (scmtips; Umbrex). See both metrics on your data in a short demo.
Why do forecasts look better at the national level?
Random errors offset each other as more items and regions are combined, so aggregate error is always lower than SKU error. Decisions on stock are made at the lower level. Ask support for a cancellation check on your forecast.
How do we compare accuracy across beverage, snack, personal care and household?
Build your own benchmark with the same grain, lead time and a naive baseline for every category, because no reliable public split exists. Compare forecast value added, not raw error. Plan a category benchmark with our planners.
Does iFactory AI promise a specific accuracy figure?
No. Accuracy depends on your data, categories and level, so iFactory AI measures it on your history against a naive baseline and reports bias beside error. See the scorecard built on your data.
Quote an Accuracy Number You Can Defend
See iFactory AI score your forecasts by level, region and horizon against a naive baseline. Book a review using your own forecast and sales history.