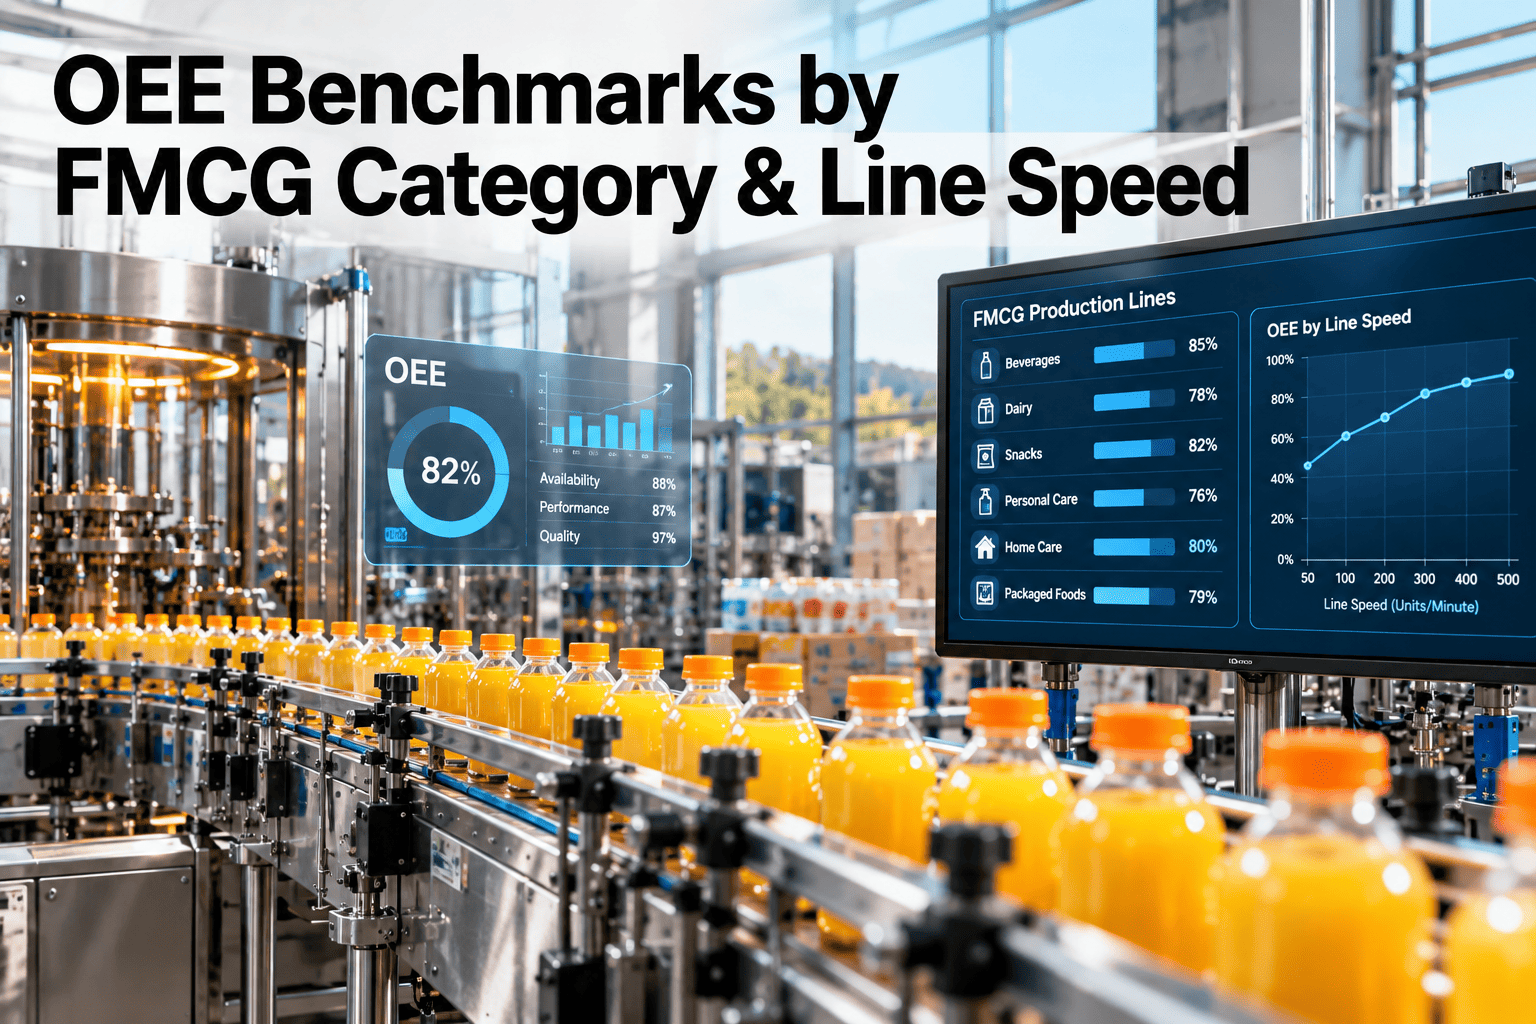
A beverage line running at several hundred units a minute and a personal care line filling and capping a more viscous product at a fraction of that speed will never land on the same OEE number, even on their best days, yet both too often get compared against the same single enterprise target. A benchmark that ignores category, line speed, line age, shift pattern, and product complexity isn't really a benchmark, it's a number that happens to apply to whichever line it was calculated from. Building realistic ranges by category instead of chasing one universal figure is what a category-specific OEE benchmark looks like against your own line data.
One OEE Target Doesn't Fit Beverage, Snack, Personal Care, and Household
iFactory AI's OEE and Micro-Stoppage Analytics platform benchmarks your lines against realistic, category-specific ranges instead of one universal enterprise target.
Why a Single OEE Target Misleads Across Categories
OEE is calculated the same way everywhere, availability times performance times quality, but what's realistically achievable on that formula varies enormously by what's actually running through the line.
Line Speed Changes the Performance Math
A high-speed line has less time to recover from a micro-stoppage before it registers as a meaningful performance loss, which structurally disadvantages fast lines in a flat comparison.
Product Complexity Drives Changeover Frequency
A category running frequent SKU changeovers for package variety carries more availability loss by design than a category running long, uninterrupted campaigns.
Line Age and Shift Pattern Both Shift the Ceiling
An older line with more wear-related micro-stoppages, or a line running three shifts versus one, both face a meaningfully different realistic ceiling for OEE.
Illustrative Range Patterns by Category
The ranges below are an illustrative pattern, not a verified industry benchmark report, meant to show how the realistic range shifts by category characteristics rather than to set a specific target number for any plant.
| Category | Typical Speed Profile | Typical Changeover Frequency | What Shapes the Realistic Range |
|---|---|---|---|
| Beverage | High speed, continuous fill | Low to moderate | Micro-stoppage sensitivity at high speed dominates the gap |
| Snack | High speed, multi-lane packaging | Moderate to high | Changeover frequency and package format variety |
| Personal Care | Moderate speed, viscous fill | Moderate | Fill accuracy and quality loss sensitivity |
| Household | Variable, often multi-format | High | SKU proliferation and format changeover time |
A useful benchmark compares a line against others sharing these same characteristics, not against a category it has little in common with, and ideally against its own best demonstrated performance under realistic conditions.
Build a Benchmark From Your Own Line History
Bring OEE data from your own lines to a 30-minute session and build a realistic range specific to their category, speed, and age.
Building a Benchmark That Reflects Your Own Lines
A generic published figure is a starting reference point, not a finish line. The most useful benchmark is built from a line's own demonstrated capability under realistic conditions.
Questions to Ask Before Trusting Any OEE Benchmark
Whether the benchmark comes from a published source or an internal comparison, these checks reveal whether it's actually usable.
An Illustrative Comparison: Flat Target vs Category-Adjusted Target
The figures below are a labeled illustrative composite, not a reported customer result, showing how a line's apparent performance gap can shift once compared against a category-adjusted target instead of one flat enterprise figure.
We see plants chase a single OEE number set at the enterprise level more often than we see them build benchmarks that actually reflect what each line is capable of given its speed, mix, and age. The result is usually frustration on the high-mix, high-speed lines that were never going to hit the same number as a slower, low-mix line, even running excellently, while genuine underperformance on an easier line goes unnoticed because it's clearing the same flat bar without much effort.
Frequently Asked Questions
Is there a single published OEE number we should be targeting?
A commonly cited reference figure exists in general manufacturing literature, but applying it uniformly across different FMCG categories, speeds, and line ages tends to mislead more than it helps, which is why a realistic target built from your own line's demonstrated capability is usually more useful than chasing a single published number. Build a target specific to your own lines in a short session.
How do we group our lines for a fair internal comparison?
Grouping by speed class, product category, and changeover frequency together, rather than any single factor alone, tends to produce the most meaningful comparison groups, since two lines in the same product category can still differ significantly in speed and mix. Ask the iFactory AI team how to group your specific lines.
How does micro-stoppage data factor into a category-adjusted benchmark?
High-speed lines accumulate performance loss from brief stoppages faster than slower lines simply due to the math of the calculation, so tracking micro-stoppage patterns specifically, not just an aggregate OEE number, is what reveals whether a fast line's apparent gap is a real issue or a structural artifact of its speed. Review micro-stoppage patterns on your own lines in a demo.
Should an older line be held to the same target as a newer one?
An older line's realistic ceiling is often genuinely lower due to accumulated wear and higher micro-stoppage frequency, so a fair target accounts for line age explicitly rather than assuming all equipment should perform identically regardless of its install date and maintenance history. Factor line age into your targets on a call.
Can this connect to our existing OEE reporting system?
Category-adjusted benchmarking is built to layer on top of the OEE and micro-stoppage data your lines already generate, refining how that existing data is compared rather than requiring a separate parallel measurement system. Discuss integration with your current OEE system with the support team.
Compare Your Lines Against a Target That Actually Fits Them
iFactory AI benchmarks OEE by category, speed, and line age instead of one flat enterprise target. Book a walkthrough built around your own plant.