Most FMCG plants can describe their recall process in a document. Far fewer can tell you, with a number, how long it actually takes from the first alert to a complete list of every affected lot. That gap between a written procedure and a measured outcome is exactly where recall readiness quietly fails, because the first real test of the process tends to happen during an actual recall, not a drill. A trace-down speed KPI closes that gap by turning readiness into something you track, benchmark and improve on a schedule, instead of something you assume. Quality and operations leaders can see how iFactory AI measures trace-down speed against your own historical drills before the next readiness review.
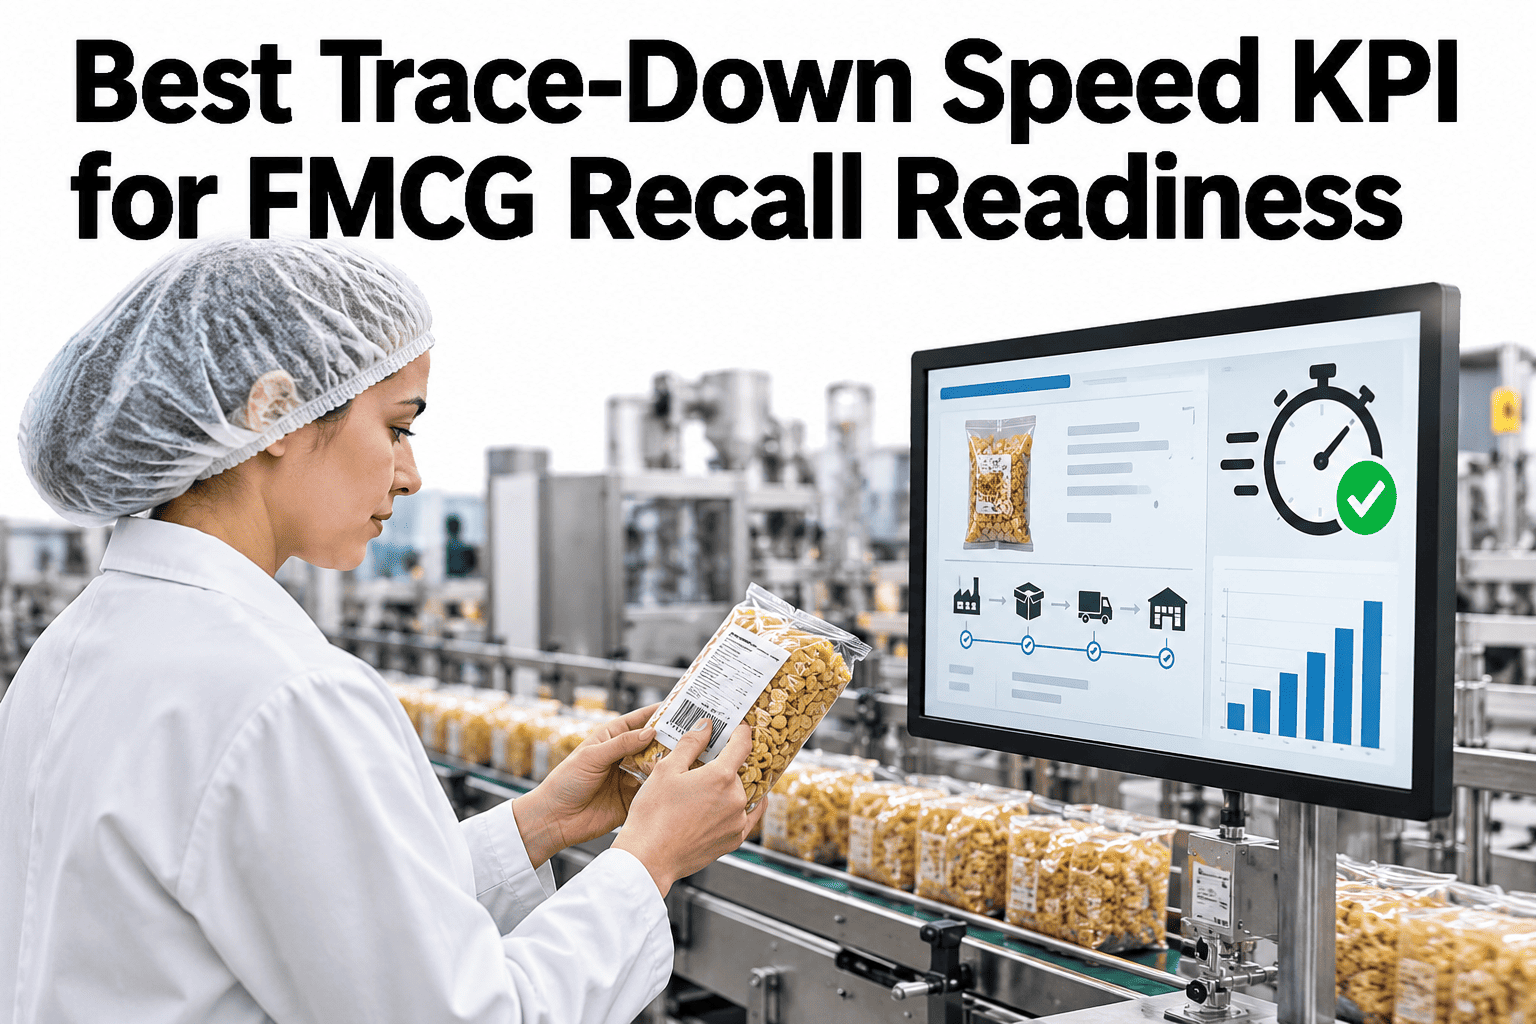
Best Trace-Down Speed KPI for FMCG Recall Readiness
Measure the time from first alert to complete lot identification, and make it something you track, not something you assume.
Why "We Have a Recall Plan" Is Not the Same as Being Ready
A written plan describes the steps. A measured trace-down speed tells you whether those steps actually work under the time pressure a real recall creates.
Steps are documented, but no one has timed how long they actually take to execute.
A single drill gives one data point, which may not reflect normal variation in staffing or data quality.
Trace-down speed is measured repeatedly, showing a trend and flagging regressions.
The goal is not a single good drill result, it's a KPI you trust because it has been measured consistently enough to mean something.
What the Clock Actually Measures
Defining the start and end points precisely matters, because a vague definition makes the KPI impossible to compare over time.
| Stage | What Marks It | Why the Boundary Matters |
|---|---|---|
| Clock starts | First alert received, whether internal or external | A vague start point makes the duration incomparable between drills |
| Batch identified | The specific batch or batches implicated are confirmed | An intermediate checkpoint shows where time is actually spent |
| Clock stops | Complete list of every affected lot, including distribution, is ready | Stopping early at "batch identified" understates the real recall task |
Benchmark Your Own Trace-Down Speed
Book a 30-minute session and iFactory AI will walk through a timed mock trace using your own systems to establish a real trace-down speed baseline.
Where Time Actually Goes
Breaking the total time into segments shows which part of the process is the real bottleneck, rather than treating the whole duration as one undifferentiated number.
Running a Drill That Actually Measures the KPI
A drill only produces a usable number if it's run consistently enough to compare against the next one.
Pick a realistic scenario
Choose a complaint or alert type that reflects a plausible real trigger.
Start the clock at first alert
Record the exact moment the scenario is introduced to the team.
Let the real process run
No shortcuts or hints, use the actual systems and people who'd respond.
Stop at the complete lot list
Record the time and review what slowed the process down.
The quality teams who trust their trace-down speed number are the ones who run drills on a fixed schedule with a consistent definition of start and stop, rather than running a one-off drill after an audit finding and treating that single result as proof of readiness. A trace-down speed that looked fine eighteen months ago can degrade quietly as a plant adds new SKUs, changes distributors or loses the one person who understood the manual reconciliation step, and without a repeated measurement, that degradation goes unnoticed until a real recall exposes it. Schedule drills regularly, keep the definition identical each time, and treat a slowing trend as seriously as a single bad result.
Where iFactory AI Fits
iFactory AI measures trace-down speed from connected traceability data, so the KPI reflects what the system can actually deliver, not what a manual drill happens to achieve on a good day.
Automated timing
Trace-down speed is measured consistently from a defined start point to a complete lot list, every time.
Segment breakdown
Time is broken down by stage, showing exactly where delays concentrate.
Trend tracking
Trace-down speed is tracked over time, flagging a slowing trend before it becomes a real liability.
Ask in plain language
Ask how trace-down speed has changed since the last drill and receive a direct answer.
Frequently Asked Questions
What exactly should "trace-down speed" measure?
The time from first alert, whether internal or external, to a complete list of every affected lot including distribution, not just the moment a single implicated batch is identified. Defining both endpoints precisely is what makes the KPI comparable from one drill to the next. You can watch a trace-down speed measurement run on sample data in a live session.
How often should we run a trace-down drill?
On a fixed, regular schedule, since trace-down speed can degrade quietly as SKUs, distributors or key staff change, and a single drill run only after an audit finding does not catch that kind of drift. To set up a recurring measurement, request a drill scheduling session with the iFactory AI team, or ask support what data supports automated timing.
What is a good trace-down speed benchmark?
There's no universal figure, since it depends on your product complexity, distribution network size and how connected your systems already are, so the most useful benchmark is your own measured baseline compared against itself over time. A short product tour of trend benchmarking shows how this comparison is built.
How do we find out which part of our process is actually slow?
Break the total trace-down time into segments, such as batch identification versus distribution trace versus lot list compilation, and time each separately, since the total number alone doesn't show where to focus improvement effort. See how segment-level timing is tracked in a guided walkthrough.
Does a fast trace-down speed also help outside of an actual recall?
Yes. The same connected data and process that speeds up a recall trace also supports faster complaint investigations, audit responses and routine quality reviews, since they all draw on the same underlying linkage between batches, materials and distribution. Schedule a walkthrough of broader uses for connected trace data to see how this applies beyond recalls.
Know Your Real Trace-Down Speed, Not Your Assumed One
iFactory AI measures trace-down speed from connected data and tracks it over time. Book a walkthrough to see it built around your own recall readiness process.