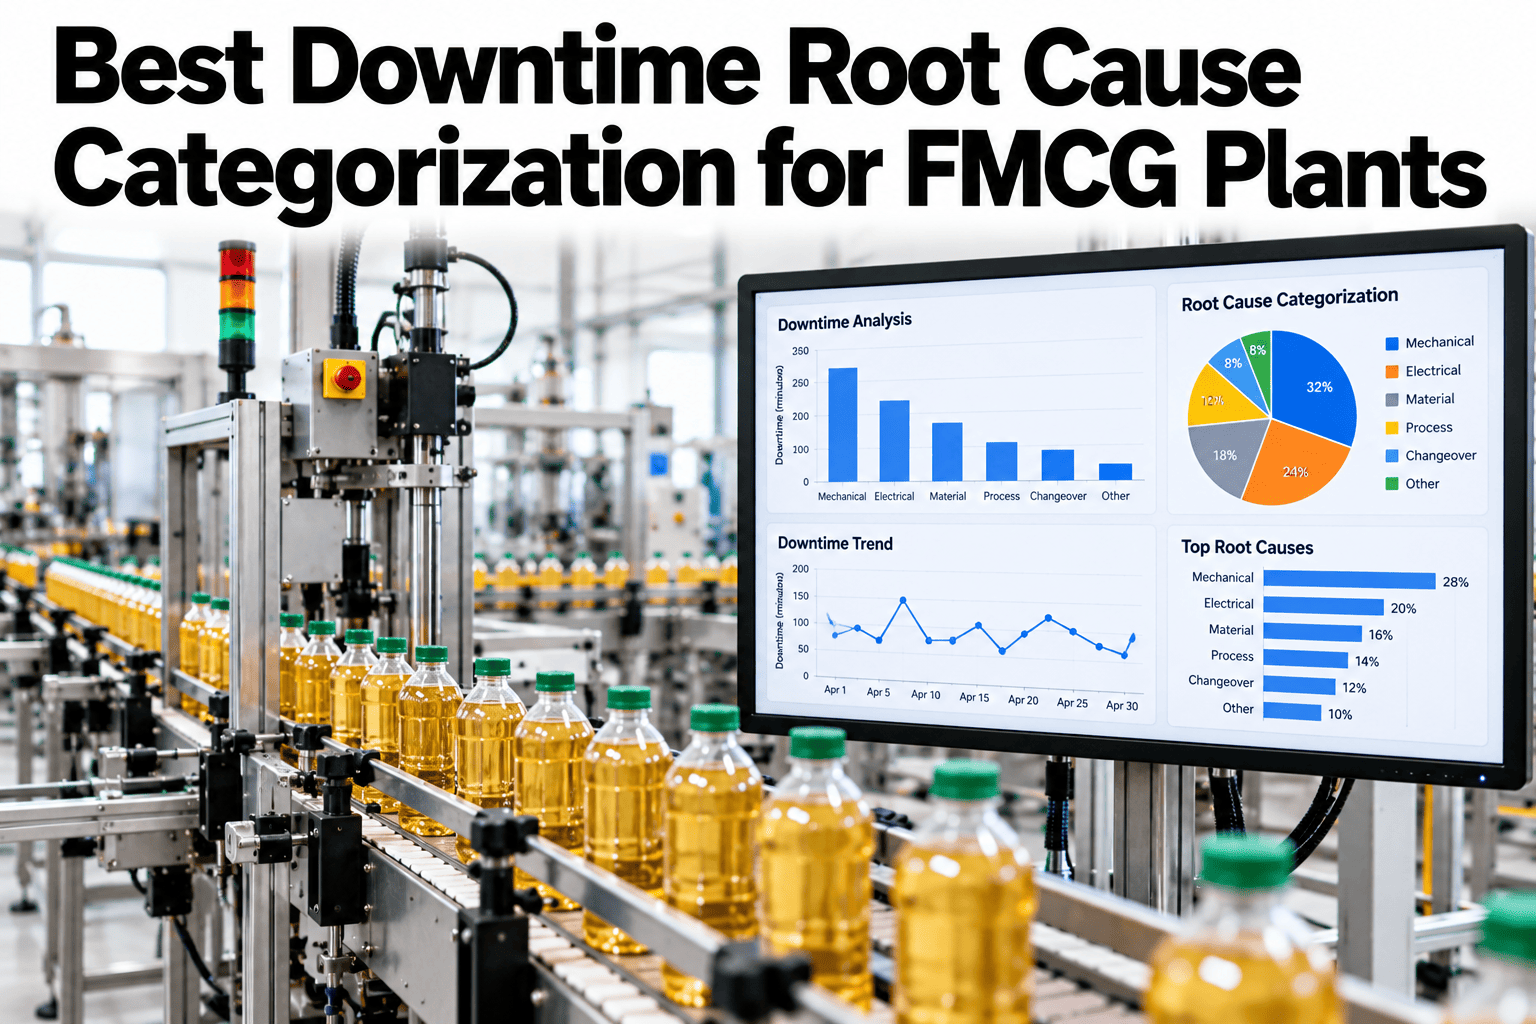
Most FMCG plants can tell you how many minutes a line was down last week. Far fewer can tell you why, in a way two different shifts would describe the same way. One operator logs a jammed carton as a mechanical fault, another as a material issue, and a third as "other," so the Pareto chart the plant reviews every Monday is really a chart of how people felt about the stop. A clean root cause taxonomy fixes that at the source, with a small set of buckets and sub-categories that mean the same thing on every line. Plant and reliability leaders can see a shared root cause taxonomy applied to their own downtime log on iFactory AI before the next review cycle.
If Two Shifts Log the Same Stop Differently, the Pareto Lies
iFactory AI applies one consistent root cause taxonomy across every line, so the downtime ranking reflects what happened, not who logged it.
Why Downtime Data Rarely Agrees With Itself
Free-text reasons and long dropdown lists feel flexible, but they let every person invent a slightly different answer for the same event. Over a quarter, those small differences add up to a dataset nobody trusts.
A list of eighty reasons gets skimmed, and operators pick the first one that looks close.
A jam can reasonably be mechanical, material or method, with nothing to break the tie.
When "Other" is the largest bar, the chart is hiding the real answer.
Each shift interprets the same label differently without a written rule.
Six Buckets That Cover Almost Every Stop
A small top level keeps classification fast. Six buckets are usually enough to place nearly any stop on an FMCG line, with sub-categories underneath for the detail.
| Bucket | What It Covers | Example Sub-Categories |
|---|---|---|
| Mechanical | Physical wear, breakage and misalignment | Bearing failure, belt wear, seal leak, guide misalignment |
| Electrical | Power, wiring and drive faults | Motor trip, drive fault, power dip, loose connection |
| Controls | Sensors, PLC logic and software | Sensor drift, false trip, interlock fault, recipe error |
| Material | Incoming ingredient or packaging problems | Film defect, carton variation, ingredient out of spec |
| Method | Procedure, setup and changeover | Wrong setting, incomplete changeover, missed cleaning step |
| People | Availability, skill and handling | No operator, training gap, incorrect manual adjustment |
See Where Your Own Stops Would Land in Six Buckets
Bring a month of downtime reasons to a 30-minute session and map them to a shared taxonomy.
Rules That Keep a Taxonomy Honest
Capturing the Cause at the Line, Not in the Office
The best taxonomy fails if the cause is guessed at the end of the shift. Capturing the reason while the stop is still fresh, from the person who saw it, is what keeps the data usable.
Duration and machine are recorded automatically.
The operator picks one of six clear buckets.
A short list under that bucket narrows the cause.
Odd entries and growing "Other" counts get corrected.
What the Pareto Looks Like Once the Data Is Clean
A ranking only helps if the top bar is real. When "Other" or an overloaded mechanical bucket sits at the top, the next step is to fix the taxonomy, not the machine.
When a Stop Could Belong to Two Buckets
Edge cases are where taxonomies quietly fall apart. The fix is a written tie-break rule for each common ambiguous stop, so two operators facing the same event reach the same answer.
| Ambiguous Stop | Tempting Labels | Tie-Break Rule |
|---|---|---|
| Carton jam at the infeed | Mechanical, material, method | Label by the first cause found: guide wear is mechanical, warped cartons are material, a wrong setting is method |
| Sensor trips with nothing wrong | Mechanical, controls | If the machine was healthy and the signal was false, it is controls |
| Line waits for film or ingredient | Material, people | Supply that never arrived is material; supply nobody fetched is people |
| Changeover runs long | Method, people | A missing or unclear procedure is method; a skill or staffing gap is people |
| Drive faults after a power dip | Electrical, controls | Supply-side events are electrical; a faulty drive setting is controls |
Bucket by Bucket: A Quick Rule of Thumb
Something physical wore, broke, loosened or moved out of position. If a person with a spanner could see it, it is probably mechanical.
Power did not reach the equipment as intended, or a drive, motor or connection failed. Look for trips, dips and burned or loose wiring.
The machine was healthy but the sensing or logic told it to stop. False trips, drifted sensors and recipe errors live here.
An input did not meet its specification or did not arrive. Film, cartons, labels and ingredients are the usual sources.
The way work was set up or done caused the stop. Wrong settings, skipped steps and unclear procedures belong here.
Availability, skill or handling was the limiting factor. Use it carefully, since it should explain the cause, not blame the person.
Loose Reasons vs a Shared Taxonomy
A Monthly Review Rhythm That Keeps the List Healthy
Re-check a random set of entries against the written definitions.
Decide whether each entry needs a new sub-category or a correction.
Add a tie-break rule for any stop two people labeled differently.
Share updates with every shift so the meaning stays shared.
Signs the Taxonomy Is Actually Working
A Second Scenario: The Line That Blamed Its People
Picture a line where "people" climbs to the top of the ranking every month, and leadership responds with extra training sessions that change nothing. The label had become a catch-all for any stop where the operator was standing nearby.
After the definition was tightened to cover only genuine availability and skill gaps, most of those stops moved to method, where an unclear changeover procedure turned out to be the real cause. Fixing the procedure removed the loss, and the training budget was redirected to where it was needed.
A Composite Scenario: The Pareto That Pointed the Wrong Way
Picture a plant whose weekly Pareto shows mechanical faults as the largest loss, so a bearing replacement program gets funded. Nothing improves, and the team cannot understand why the same line keeps stopping.
A closer review of the logged reasons shows many "mechanical" stops were really sensor false trips that operators recorded under the nearest familiar label. Once controls became its own bucket, the real top loss was visible, and the investment moved to sensor and interlock fixes.
Where iFactory AI Fits
Applies one taxonomy
Uses the same buckets and sub-categories across every connected line.
Prompts at the moment of the stop
Asks for the reason while the event is fresh, from the person who saw it.
Watches the "Other" bucket
Flags when uncategorized time grows so the list can be corrected.
Builds the ranking automatically
Produces a Pareto by total minutes lost, by line, shift and period.
Expert Review
A reliability engineering perspective, reviewed for accuracy before publication: the quality of a downtime Pareto is capped by the quality of the categories underneath it, and most plants spend their effort analyzing the chart instead of fixing the list. A small, well-defined taxonomy usually beats a large, detailed one, because people actually use it correctly. Testing a six-bucket structure against your own logged reasons shows quickly how much of your current ranking is real. Confirm specific product capabilities against your plant's systems before relying on any workflow.
Frequently Asked Questions
Why use only six top-level buckets?
A short top level is fast for operators to choose from, which improves accuracy under time pressure. Detail lives in the sub-categories underneath, where it is easier to be specific without overwhelming the first decision. Six buckets cover most stops on an FMCG line, though your plant may adjust the list. See how a six-bucket structure would fit your own lines in a short session.
How do we stop operators from choosing "Other"?
Keep "Other" available but small, and review every "Other" entry weekly to decide whether it needs a new sub-category or was simply mislabeled. A growing "Other" is a signal that the taxonomy is missing something, not that operators are careless. Ask for a review process for your largest uncategorized stops.
Who should be allowed to change the taxonomy?
A small review group, typically operations, maintenance and quality, should own changes, and updates should happen on a set schedule rather than ad hoc. Frequent informal edits make historical comparisons unreliable. Explore how a controlled review group would work for your plant.
Can we map our existing downtime reasons into the new buckets?
Usually yes, through a one-time mapping from old labels to new buckets and sub-categories. Some old entries will be ambiguous and need a decision, which is normal. A mapping preserves historical trends while moving forward on clean categories. Try a mapping exercise using your own existing reason list.
How long before the Pareto becomes trustworthy?
Many plants see a meaningfully cleaner picture within a few weeks of consistent use, though it depends on stop volume and how well operators and supervisors are trained on the definitions. Early weeks usually involve some correction as edge cases surface. Join a session on a realistic rollout timeline for your lines.
Make the Downtime Ranking Something You Can Act On
iFactory AI applies one root cause taxonomy across every line so the biggest loss is the real one. Book a walkthrough with your own downtime log.