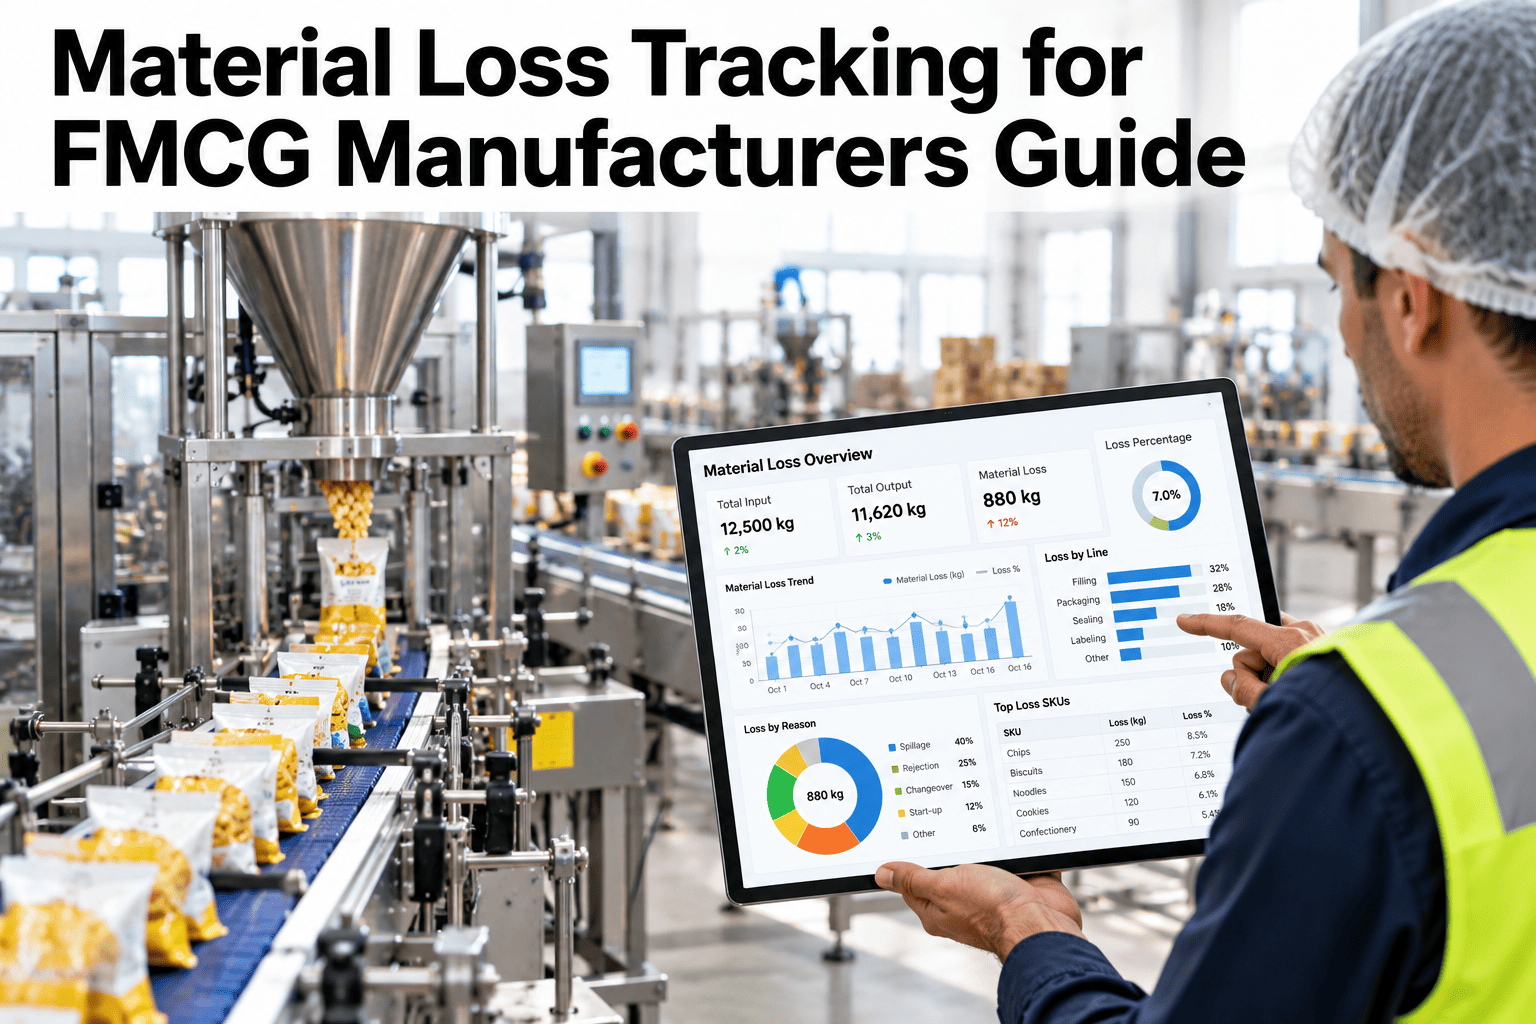
Not all material loss ends up in the scrap bin. Powder drifts away as dust, liquids evaporate, spills happen at transfers, and packs are filled a little heavier than the label requires. Each loss is small, but together they can rival visible scrap, and because they are never recorded they never get fixed. Measuring them by batch, in real time, turns invisible losses into numbers someone owns. FMCG teams who want that visibility can ask iFactory AI how material loss is measured and attributed per batch.
Measure the Material Losses You Never See in the Scrap Bin
iFactory AI attributes dust, evaporation, spillage and giveaway to each batch with real-time trends, so hidden material loss becomes a managed number.
Four Hidden Losses in FMCG Manufacturing
Each loss behaves differently and needs its own measurement approach.
Dust
Fine powders escape during conveying, mixing and filling, and show up as a mass balance gap.
Evaporation
Heated or open liquid processes lose volume or solvent over time.
Spillage
Transfers, filling and cleaning leave product on floors, hoses and equipment.
Giveaway
Filling above the declared weight or volume wastes product on every pack.
The Mass Balance Behind Every Batch
The basic test is simple. What went in must equal what came out plus what was recorded as lost. The chart shows an illustrative batch of 10,000 kg.
A Worked Giveaway Example
Giveaway is often the largest hidden loss on a high-volume line. This is illustrative arithmetic in generic currency units.
| Item | Value | Result |
|---|---|---|
| Declared fill weight | 500 g per pack | Target |
| Average actual fill | 506 g per pack | 6 g above target |
| Packs filled | 1,000,000 | Volume |
| Extra product given away | 6 g times 1,000,000 packs | 6,000 kg |
| Cost at 2 per kg | 6,000 kg times 2 | 12,000 |
How Each Loss Can Be Measured
Each loss needs a different approach. This table shows common methods and their limits.
| Loss | Typical Measurement Approach | Limit to Know |
|---|---|---|
| Dust | Mass balance on powder lines, extraction collection weights | Loss is inferred, not weighed directly |
| Evaporation | Level or weight change over time, temperature and exposure data | Depends on accurate process conditions |
| Spillage | Recorded cleaning and transfer losses, flow meter differences | Depends on discipline in recording |
| Giveaway | Checkweigher data, average and spread against the declared weight | Needs good weighing accuracy and calibration |
Find Out How Much Material Disappears Between Input and Pack
Book a 30-minute session and iFactory AI will review your batch records and checkweigher data to show where unexplained loss hides.
Where Unexplained Loss Usually Hides
The split differs by plant and product. The bar shows an illustrative view of where unexplained loss tends to sit.
From Batch Records to Attribution
Attribution means tying each loss to a batch, a line and a step. This chain shows how it works.
Which Process Areas Lose Which Material
The matrix, shown as an illustration, ranks typical loss types by process area.
| Process Area | Dust | Evaporation | Spillage | Giveaway |
|---|---|---|---|---|
| Raw material handling | High | Low | Moderate | Low |
| Mixing and blending | Moderate | Moderate | Moderate | Low |
| Heated or open vessels | Low | High | Moderate | Low |
| Transfers and cleaning | Low | Low | High | Low |
| Filling and packing | Moderate | Low | Moderate | High |
Material Loss Review Checklist
Run this list at the weekly meeting. Each box should be answerable from batch data.
A Composite Scenario: The Quiet Giveaway
This is a composite example, not a named plant. It shows how a small fill error becomes a large saving.
Mistakes That Hide Material Loss
These habits keep losses invisible.
Counting only scrap
Hidden losses never enter the report.
Ignoring the average fill
Passing the limit does not mean zero giveaway.
No per-batch balance
Loss cannot be attributed without a batch view.
Recording waste as other
Loss types cannot be ranked or fixed.
What iFactory AI Adds to Material Loss Tracking
iFactory AI is smart manufacturing and industrial software for FMCG and process plants. Explore loss tracking in a live product tour on realistic batch data.
Getting Started in Four Steps
A narrow start finishes faster and proves the value sooner.
Pick one line and one product with high volume.
Record input, good output and waste for each batch.
Find the largest unexplained loss and its likely type.
Change one factor and check the trend.
A 30-Day Plan to Start
A month is enough to build a first loss picture for one line.
Review of FMCG Material Loss Tracking
A practical review of what makes loss tracking credible, written as editorial guidance rather than a named expert quote.
Start with the balance
A per-batch mass balance shows the size of the problem before any detail.
Look at the average, not the limit
Fill within limits can still hide steady giveaway.
Name the loss type
Loss that is coded as other cannot be fixed.
Frequently Asked Questions
What counts as material loss in FMCG manufacturing?
It includes visible scrap and hidden losses such as dust, evaporation, spillage and giveaway. See all four hidden losses on a live batch in a short demo. The hidden ones are often the least measured and most persistent.
How do I measure giveaway?
Use checkweigher data to compare the average fill with the declared weight, and look at the spread as well. The extra weight multiplied by pack volume gives the cost. Reducing spread allows the average to move closer to target.
Can dust and evaporation losses be measured accurately?
They are usually inferred through mass balance and process data rather than weighed directly. Ask support how inferred losses are flagged and validated in the system. Trends are still highly useful even when the exact figure is uncertain.
Do we need new sensors?
Often not at first. Batch weights, checkweigher data and recorded waste already hold much of the story. Additional sensing can be added where the balance shows a large unexplained gap.
How soon can we see results?
Many plants find a clear unexplained loss within weeks of building batch balances for one line. Book time to scope a material loss pilot with your operations team. A quantified loss makes the next step easy to approve.
Turn Invisible Losses Into Numbers Someone Owns
iFactory AI measures dust, evaporation, spillage and giveaway per batch so hidden material loss gets fixed. Book a walkthrough to see it on your own batches.