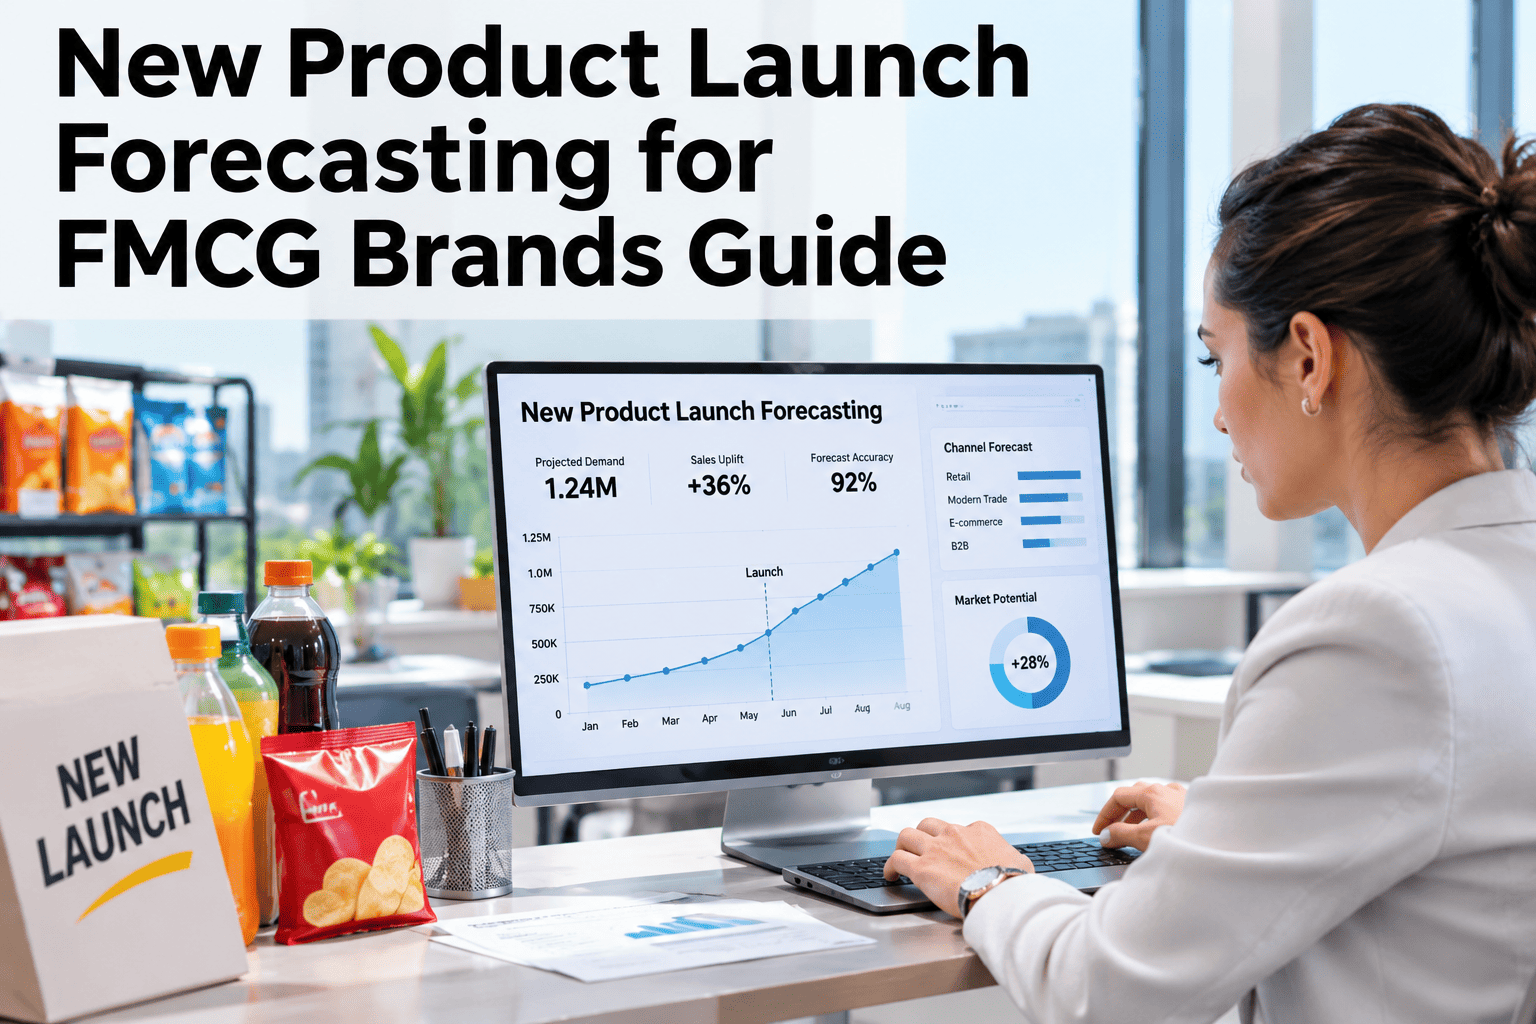
A new SKU has no sales history, which breaks every forecasting method built on one, and the first few weeks of orders after launch make the problem worse rather than better — a retailer filling empty shelf space orders far more than shoppers are actually buying, and that pipeline-fill spike looks exactly like real demand on a shipment report. Forecasting a launch means separating that initial fill from true consumer takeaway, then modeling the ramp that follows using products that already went through the same curve. Get the pipeline fill and the ramp confused and a brand either overproduces for a launch that never sustains, or underproduces for one that is building real distribution. Brand and supply teams planning their next launch can walk through a launch forecast built on real analog data with our team.
Separate the Pipeline Fill From the Demand That Actually Sticks
iFactory, an on-premise AI platform for FMCG demand sensing, forecasts new launches using analog-product matching and ramp-curve modeling, with pipeline fill tracked separately from true consumer takeaway.
Why Doesn't a Normal Forecasting Model Work for a New SKU?
Most demand forecasting methods fit a model to a product's own sales history, and a brand-new SKU has none. Waiting for enough real data to build a reliable model means launching with no forecast at all for the weeks that matter most for initial production and allocation decisions. By the time a conventional time-series model has enough history to trust, the launch window it was meant to inform has already passed. Ask our team how your current process handles a launch with zero history.
How a Launch Forecast Gets Built Without History
| Method | What it uses | Best for |
|---|---|---|
| Analog matching | Sales curves from 2-5 similar past launches | Setting the initial shape and time-to-peak |
| Bottom-up funnel | Distribution reach, trial rate, repeat rate assumptions | Sanity-checking the analog-based total |
| Adoption curve modeling | S-curve or similar diffusion shape | Shaping the ramp once early real data arrives |
Find the Right Analog Products for Your Next Launch
Share your upcoming launch's category and price point, and we will identify comparable past launches to anchor the forecast.
Pipeline Fill Is Not Demand — It Just Looks Like It
When a new SKU launches, a retailer orders enough to stock every store's shelf space at once, a one-time event that produces a large initial order with no relationship to ongoing sell-through. Reading that spike as demand and planning production to sustain it is one of the most common and costly launch forecasting mistakes, and it is also one of the easiest to avoid once the two signals are tracked separately.
From First Order to a Standard Reference SKU
Initial distribution orders stock the shelf, independent of sell-through.
Real consumer takeaway builds along an S-curve as awareness and trial grow.
The SKU reaches a steady velocity and moves onto standard forecasting methods.
The Launch That Looked Like a Hit for Three Weeks
A new snack SKU's week-one shipment volume beat every internal projection, and early excitement pushed a production increase to keep pace. By week four, POS data showed true sell-through tracking well below the shipment curve — the early spike had been pipeline fill, not sustained demand.
Why the Analog Library Gets More Useful With Every Launch
The first launch forecast a brand builds has the thinnest analog library to draw from, but every completed launch afterward adds another comparable curve to match against. A brand running several launches a year ends up with a growing, increasingly specific library of its own past performance, which tends to produce better-anchored forecasts than relying on generic category benchmarks alone.
A Launch Forecast That Updates as Real Data Arrives
Analog Product Matching
Comparable past launches are identified by category, price point and distribution profile.
Pipeline Fill Separation
Initial distribution orders are tracked apart from POS-confirmed consumer takeaway.
Ramp Curve Modeling
The forecast reshapes weekly as real sell-through data replaces the analog-based estimate.
Turnkey On-Premise Deployment
Launch and POS data stay on your own server, with no outside cloud dependency.
What Brand and Supply Teams Ask About Launch Forecasting
How many analog products should we use to anchor a launch forecast?
Most practitioners use two to five comparable past launches, chosen for similarity in category, price point and distribution strategy rather than simply picking the most recent launch available. Discuss analog selection for your upcoming launch.
How long does pipeline fill typically distort the shipment data?
It varies by distribution strategy and retailer, but the distortion is usually concentrated in the first few weeks after launch, after which POS data becomes the more reliable signal to forecast against. Ask support how fill duration is estimated.
When does a launch stop being a launch?
The transition to standard forecasting methods should be a deliberate decision based on the SKU reaching a steady, stable sell-through velocity, not an automatic cutoff after a fixed number of weeks regardless of how the ramp is actually progressing. Discuss stabilization criteria for your launches.
What if our new product has no good analog at all?
A genuinely novel product relies more heavily on the bottom-up funnel model and market sizing, with the analog curve used loosely for shape rather than as a close match, and the forecast is revised more aggressively once early data arrives. Discuss forecasting a novel launch with our team.
How quickly can the forecast correct once POS data starts coming in?
A forecast built to refresh weekly against incoming POS data can correct within the first few weeks of real sell-through, well before a quarterly review would have caught the same shift. Ask about refresh frequency for your launch forecasts.
Forecast the Launch, Not Just the First Order
See analog matching, ramp-curve modeling and pipeline fill separation applied to your next new product launch.