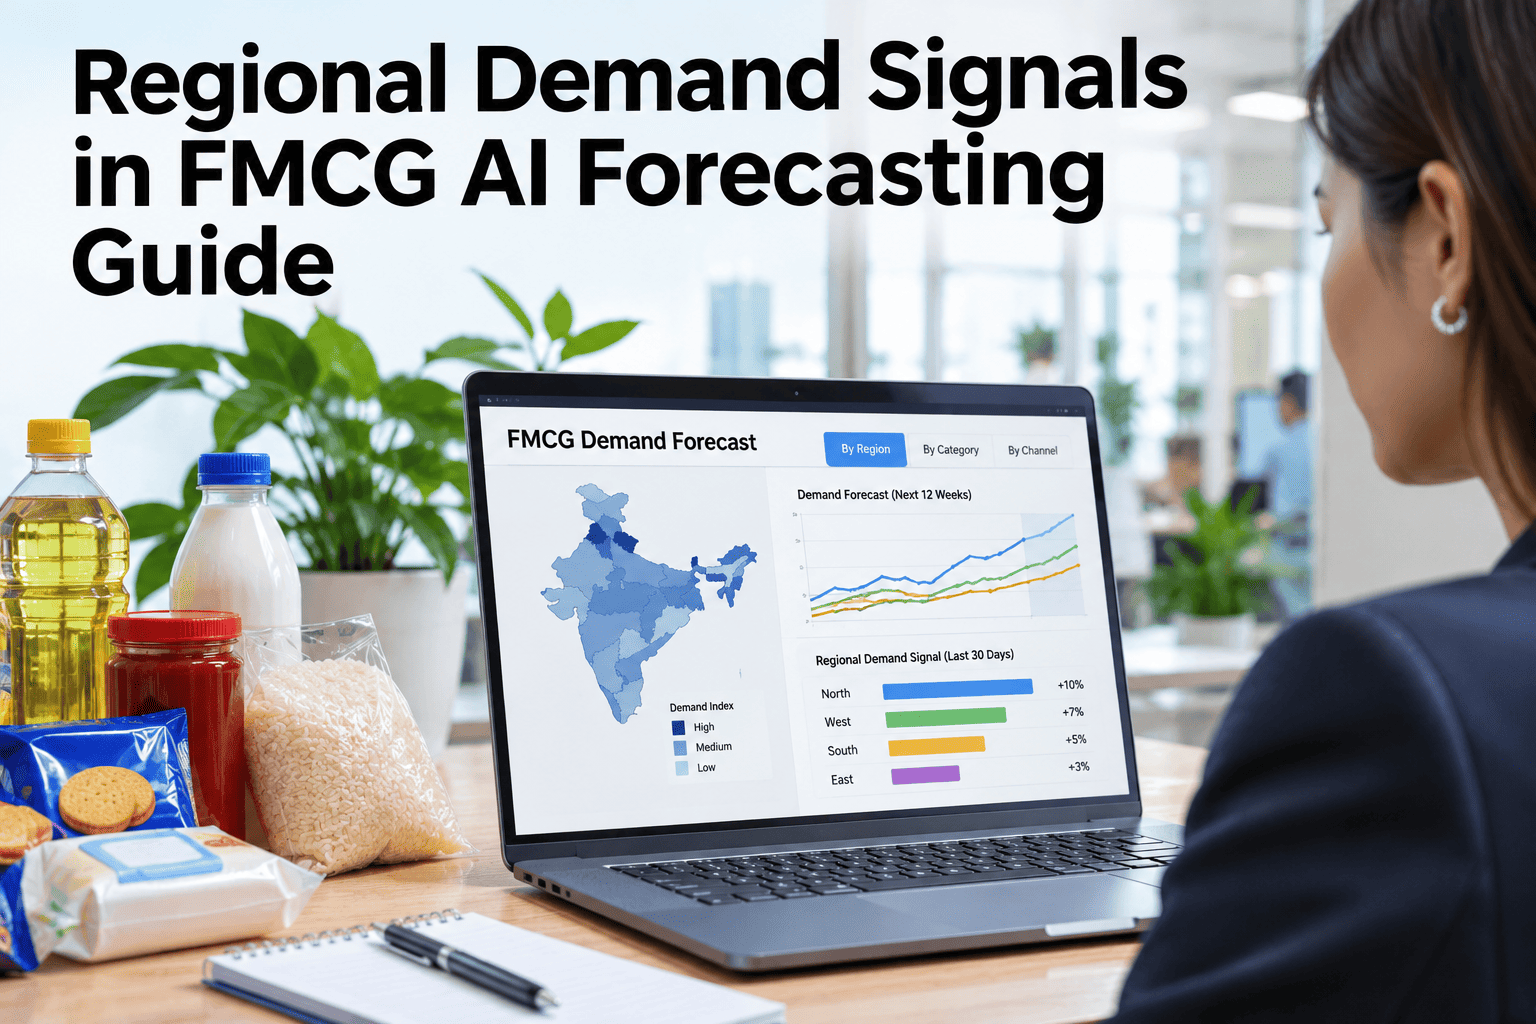
Regional demand signals in FMCG AI forecasting are the local patterns that a national number averages away: market-level, city-level and store-level differences in weather, events, distribution, price and competitor presence. A national forecast can look accurate while regional errors cancel out and the brand loses sales in both directions. Forecasting at each level and reconciling the results keeps every plan consistent. In a typical hierarchy, the store, city, region and country forecasts must add up to the same total. Demand teams can see regional variance hidden in their own national forecast in a short session.
A National Index of 100 Can Hide a Region at 60 and Another at 140
iFactory AI, an on-premise industrial AI platform, senses demand by market, city and store, then reconciles every level to one plan.
118
96
62
101
100
139
87
104
93
What Are Regional Demand Signals in FMCG Forecasting?
They are the drivers that differ by place: local weather, festivals and events, distribution gaps, retailer mix, price and competitor activity. Three facts show why national numbers mislead.
How Much Error Does a National Average Hide?
Compare total absolute error with the net error. When they differ, regional errors are offsetting. The cancellation indicator makes this visible (Fitgap).
Which Levels Should the Hierarchy Cover?
Geography forms a tree: country, region, city, store. Each level has its own noise and its own signal. Teams can ask for a hierarchy design sheet that maps their own markets.
Find the Region Your National Forecast Is Missing
Share regional sales and forecast history. iFactory AI's team will show where errors offset and which markets need their own signals.
How Do You Reconcile Forecasts Across Levels?
Forecasts made independently at each level rarely add up. Reconciliation adjusts them so store, city, region and country agree (Burba and Chen).
| Method | How It Works | Strength | Weakness |
|---|---|---|---|
| Bottom-up | Forecast stores, then sum upward | Captures local trends | Noisiest series carry the total |
| Top-down | Forecast the total, then split by share | Smooth and quick | Misses local shifts |
| Optimal combination | Weighted adjustment across all levels (MinT) | Often best overall | Needs more set-up and explanation |
Which Local Signals Move Regional Demand?
Daily store-level work needs daily weather by store region, not a national average. Local events such as concerts, sports and festivals also explain sudden shifts (Cleverence).
What Does Regional Accuracy Look Like Side by Side?
Show error and bias by region next to each other, so the weakest market is obvious at a glance. The matrix below is an illustrative layout, not a benchmark, and the labels should be replaced with your own measured values.
| Region | WAPE | Bias | Reading |
|---|---|---|---|
| Region A | High | Positive | Tighten overrides and promotion uplifts |
| Region B | High | Near zero | Volatile demand, so sense demand and plan at a higher level |
| Region C | Low | Near zero | Healthy, keep monitoring |
When Should You Plan Locally and When Nationally?
The choice is not all or nothing. Many teams plan fast movers locally and slow movers at a higher level, then reconcile both into the same national total.
How Do You Add Regional Signals Step by Step?
Start with a few markets and prove the gain before scaling. Teams can plan a regional pilot with iFactory AI's team.
Which Mistakes Hide Regional Variance?
Where Does iFactory AI Fit in Regional Forecasting?
iFactory, an on-premise AI platform for manufacturing, forecasts at each level of the hierarchy and reconciles them into one plan for the plant.
Multi-Level Forecasts
Market, city and store forecasts run side by side.
Reconciliation
Every level adds up to the same total.
Regional Signal Features
Weather, events and price are mapped to each region.
Region Accuracy View
Error and bias are shown by region, not just overall.
Expert Review: Judging a Regional Forecasting Setup
Frequently Asked Questions
Why can a national FMCG forecast look accurate and still fail?
Regional over- and under-forecasts can cancel out in a national total, so the headline error looks small while some regions run short and others hold excess (Crisp, 2026). See the hidden error in your forecast in a short session.
What is hierarchical forecasting?
It forecasts demand at several levels, such as store, city, region and country, then reconciles the results so every level adds up to the same total (Burba and Chen). Walk through a reconciled hierarchy on your own markets.
Should we forecast every store separately?
Not always. Store-level data is noisy, and forecasting there raises noise and compute, so many FMCG teams forecast at a higher level and split down (Cleverence). Ask support which levels pay for your range.
What local data improves regional forecasts most?
Daily weather by store region, local events, distribution and promotion data, and competitor activity usually matter most, and daily store-level work needs local weather, not a national average. Rank your local signals with our team.
Does iFactory AI replace regional planners?
No. Regional planners keep their judgement. iFactory AI forecasts each level, reconciles them and shows error and bias by region, so planners can focus on the markets that need them. See the regional view in a demo.
Stop Planning a Country That Does Not Exist
See iFactory AI forecast by market, city and store and reconcile everything to one plan. Book a walkthrough using your own regional history.