A filler running at 94% OEE looks like a strong number right up until someone checks what the capper and the case packer downstream were actually doing during that same shift, and discovers the line as a whole only produced finished cases at a much lower effective rate because the slowest machine in the sequence was setting the real pace the entire time. Machine-level OEE answers "how well did this one asset perform," which is a different and sometimes misleading question from "how well did the line, as a connected system, actually perform." On complex multi-machine FMCG packaging lines, that difference is exactly where Overall Line Efficiency earns its place, and understanding when to use which metric is what OLE and OEE look like applied together on a real packaging line.
A Strong Machine Number Can Still Hide a Weak Line
iFactory AI's OEE and Micro-Stoppage Analytics platform tracks both machine-level OEE and line-level OLE, so the two metrics inform each other instead of telling conflicting stories.
Why Machine-Level OEE Can Mislead on a Complex Line
OEE was originally designed to evaluate a single asset. Applied as the only metric on a line with multiple interdependent machines, it can obscure exactly the bottleneck that matters most.
A Fast Machine Can Mask a Slow Downstream One
A filler running at high OEE can still spend significant time blocked or starved because a downstream capper or case packer is the actual constraint on the line's real output.
Buffer Zones Hide Interdependency
Accumulation tables and buffers between machines can absorb short stoppages, making individual machine OEE look strong while the line's true throughput is still constrained elsewhere.
Improvement Investment Can Target the Wrong Machine
Chasing the lowest individual machine OEE number can lead to investing in a machine that isn't actually the line's real constraint.
How OEE and OLE Actually Differ
The two metrics are calculated differently and answer genuinely different questions, which is why they're complementary rather than interchangeable.
| Factor | OEE | OLE |
|---|---|---|
| Scope | Single machine or asset | Entire connected line as a system |
| Question Answered | How well did this asset perform against its own capability? | How well did the line convert raw materials into finished cases? |
| Best Used For | Diagnosing a specific machine's performance issues | Understanding the line's real throughput and bottleneck |
| Risk If Used Alone | Can hide a line-level bottleneck elsewhere | Can obscure which specific machine needs attention |
The two aren't competing metrics, OLE tells you whether the line as a whole has a problem, and OEE, once you know where to look, tells you which machine is actually causing it.
Find Your Line's Real Bottleneck
Bring data from one of your packaging lines to a 30-minute session and compare its machine-level OEE against its line-level OLE.
Using Both Metrics Together
The most useful workflow moves from line-level visibility down to machine-level diagnosis, rather than starting with machine data and hoping it adds up to the right conclusion.
When Each Metric Is the Right One to Lead With
Neither metric is universally correct to prioritize, the right choice depends on what question is actually being asked.
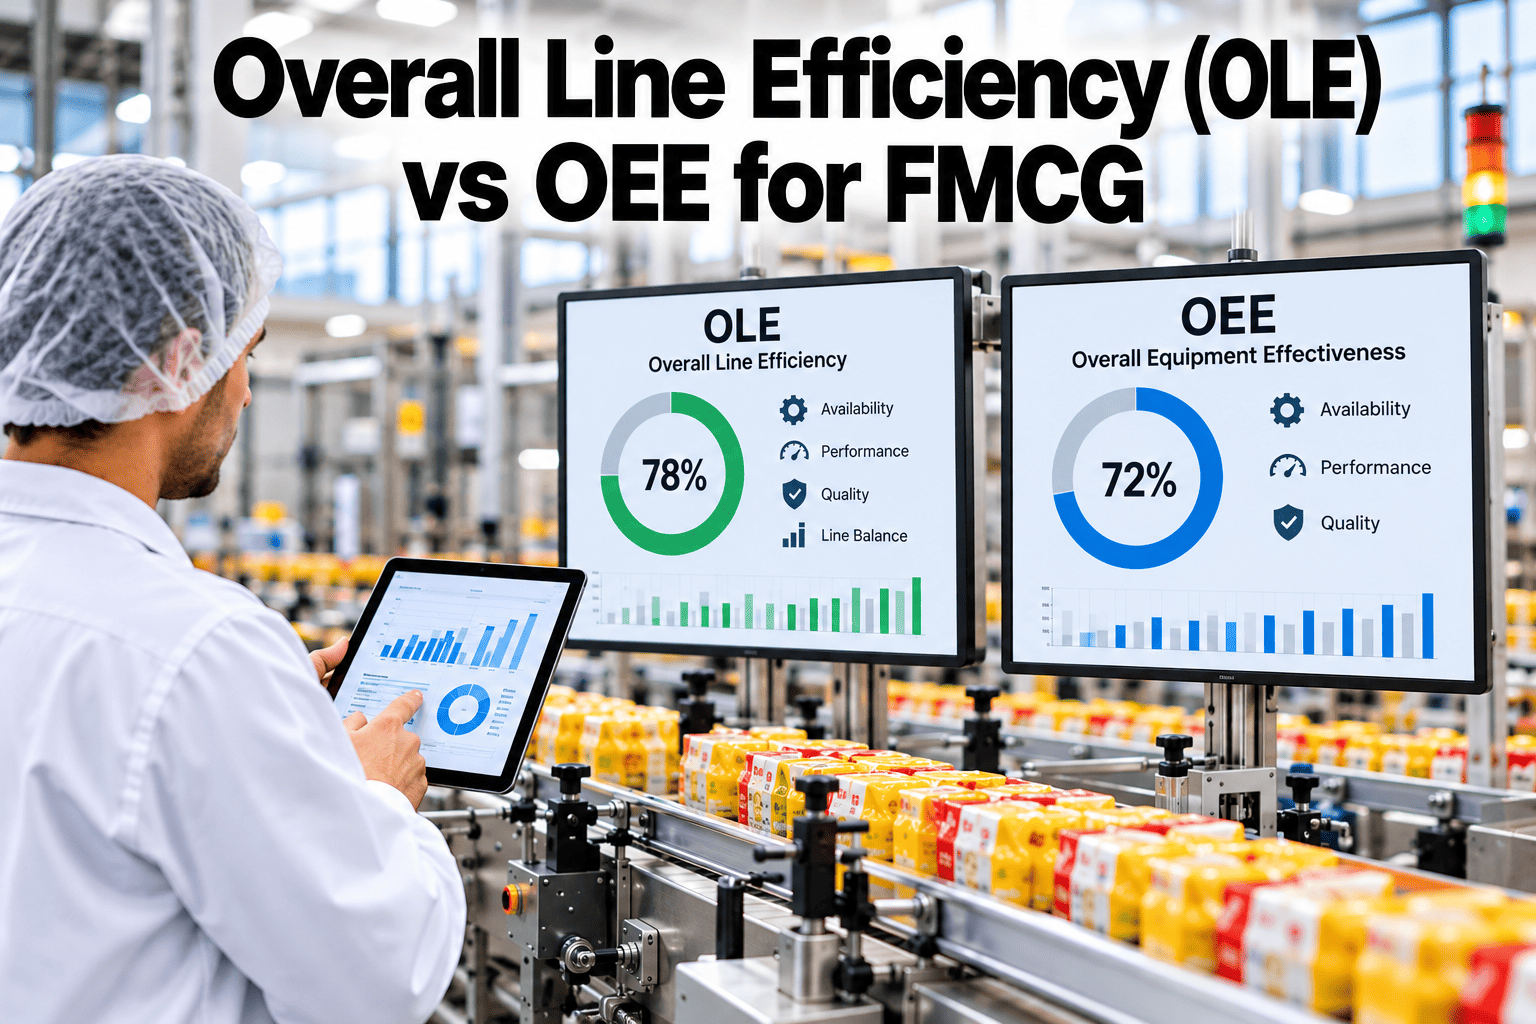
An Illustrative Comparison: Machine OEE vs Line OLE
The figures below are a labeled illustrative composite, not a reported customer result, showing how a strong individual machine OEE can coexist with a meaningfully lower line-level OLE.
The teams that get the most value out of tracking both metrics aren't the ones that pick a favorite, they're the ones that use OLE to decide where to look and OEE to decide what to fix once they're looking there. A plant that only reports machine-level OEE tends to celebrate strong individual numbers while finished-case output stays flat, because nobody's actually measuring the thing the business cares about, which is how many cases left the line.
Frequently Asked Questions
Should we stop tracking machine-level OEE and switch entirely to OLE?
No, the two metrics serve different purposes and losing machine-level OEE would remove the diagnostic detail needed to actually fix a bottleneck once OLE reveals the line has one, so the goal is tracking both together, not replacing one with the other. Set up both metrics on your own lines in a short session.
How is OLE actually calculated differently from OEE?
OLE generally measures the line's actual finished output against its theoretical maximum capacity as a connected system, accounting for blocked and starved time between machines, rather than calculating availability, performance, and quality separately for each individual asset the way OEE does. Ask the iFactory AI team to walk through the calculation for your line.
Does every line need OLE tracking, or just complex multi-machine lines?
OLE adds the most value on lines with several interdependent machines where a bottleneck could be hiding behind buffers, while a single-machine or very simple line may see less additional insight from OLE beyond what machine-level OEE already shows. Assess which of your lines would benefit most in a demo.
How do we find which machine is the real constraint once OLE flags a problem?
Blocked and starved time data for each machine on the line is usually the most direct signal, since a machine spending significant time blocked, waiting for downstream capacity, or starved, waiting for upstream supply, points directly at where the actual constraint sits. Identify the constraint on your own line on a call.
Can this connect to our existing OEE reporting?
OLE tracking is built to layer on top of the machine-level OEE data you already collect, combining it with buffer and line-state data rather than requiring a separate parallel system. Discuss integration with your current OEE reporting with the support team.
See the Line's Real Output, Not Just Its Fastest Machine
iFactory AI tracks OEE and OLE together so a line-level bottleneck never hides behind a strong individual machine number. Book a walkthrough on your own line.