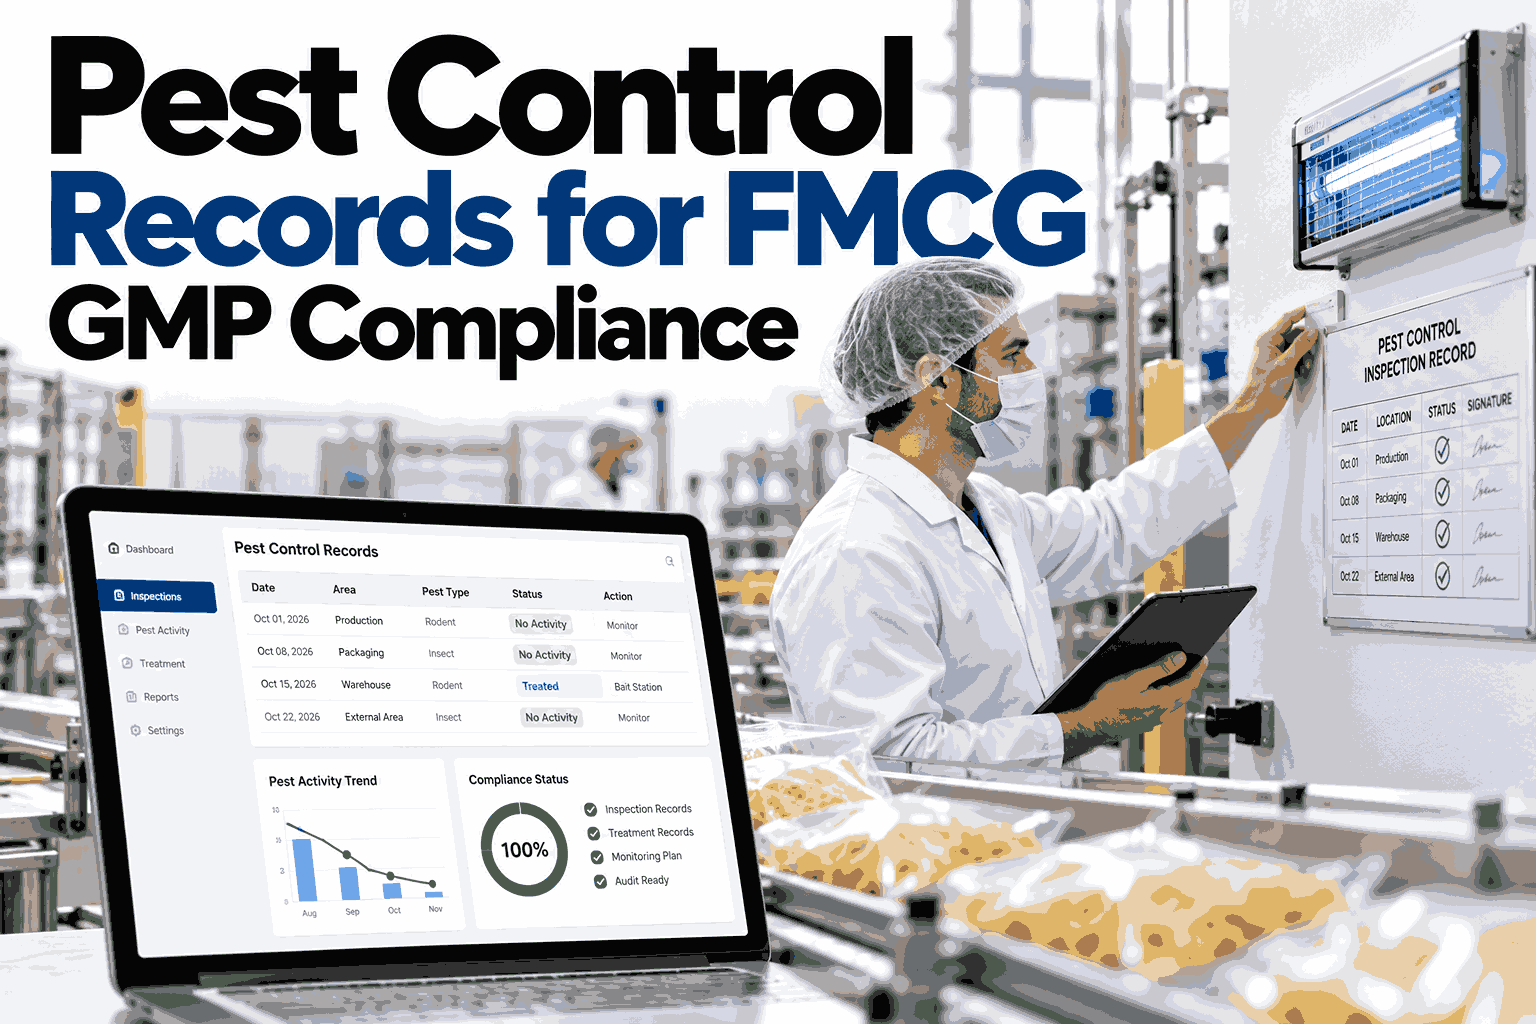
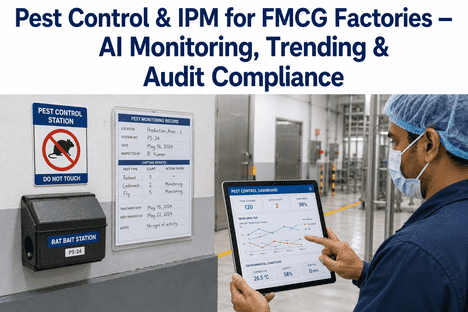
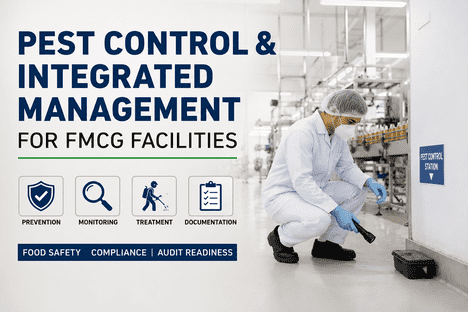
A pest control binder that looks complete on inspection day but cannot explain what happened last March is not a record, it is a performance for the auditor. FMCG plants that pass GFSI and retailer inspections treat pest records as a living data set made of a mapped device inventory, checks that happen on schedule, trend reports that trigger action, and corrective actions that actually close. Most findings come from gaps between those four pieces, not from the pests themselves, and one short session where you can see how iFactory AI structures these records on your own site layout shows which gaps you have today.
PEST CONTROL RECORDS · FMCG GMP · AUDIT READY
Pest Control Records That Hold Up When the Auditor Asks Why
iFactory AI turns device inventories, trap-check schedules, trending, and corrective actions into one connected record set that satisfies GFSI schemes and retailer inspections without a last-minute binder scramble.
Receiving Dock
6 devices, 1 activity
Raw Material Store
6 devices, clear
Production Floor
6 devices, clear
Packing Hall
6 devices, 1 activity
Finished Goods
6 devices, clear
Perimeter
6 devices, 2 activity
Checked, no activity
Activity logged, action opened
WHERE INSPECTIONS GO WRONG
Four Record Gaps Behind Most Pest Control Findings
Auditors rarely write up a plant because a mouse was found. They write it up because the records could not show that the plant was looking, noticing, and responding in a controlled way.
01
Device Map Drift
New equipment, moved pallets, and building changes leave devices on the map that no longer exist and spaces on the floor that no device covers, so the inventory stops matching reality.
02
Missed or Back-Filled Checks
A sheet with identical handwriting for six weeks in a row raises more questions than an honest gap with a documented reason.
03
Counts Without Trends
Every service visit lists activity, but nobody compares one month against the next, so a slow rise at one dock door goes unnoticed for a season.
04
Actions That Never Close
Recommendations from the contractor sit in a report with no owner, no due date, and no evidence that anything was fixed.
Each of these gaps is a records problem before it is a pest problem, which is why fixing the record structure usually reduces findings faster than adding more devices.
THE RECORD PACK
Six Records an FMCG Pest Program Should Always Be Able to Produce
GFSI-benchmarked schemes and retailer codes differ in wording, but they ask for the same underlying evidence. Think of it as one pack that can be opened in any order.
Tab A
Site Map and Device Inventory
A current plan showing every device with a unique ID, type, and location, tied to a register that records installation and removal dates.
Tab B
Check Records
Dated, signed results for each device inspection, including the condition of the device and what was found.
Tab C
Trend Reports
Activity by device, zone, and species over time, with the thresholds that trigger action written down.
Tab D
Corrective Actions
Each finding linked to an owner, due date, root cause, and evidence of closure and effectiveness.
Tab E
Treatment and Chemical Records
What was applied, where, how much, by whom, with the product label and safety data sheet on file.
Tab F
Contractor and Review Records
Licenses, insurance, scope of service, and the periodic management review of program performance.
Plants that keep these six tabs current usually answer an unannounced inspection in minutes, because every question maps to a tab. If you want to see this pack assembled automatically, you can watch it built from live site data in a working session.
DEVICE INVENTORY
What to Record for Every Device on the Floor
The inventory is the foundation of every other record. If a device is not on the map, its checks and trends cannot be trusted.
| Device Type |
Typical Location |
What to Record |
Common Audit Question |
| Exterior rodent station |
Perimeter wall, dock approach, waste area |
Unique ID, tamper-resistant status, bait or monitoring block, condition, consumption |
Are all stations numbered, secured, and visible on the map? |
| Interior rodent monitor |
Store rooms, corridors, behind equipment |
ID, trap type, result, any catch, reset or replacement |
Is coverage risk based and justified in writing? |
| Insect light trap |
Entry points, packing and dispatch areas |
ID, tube replacement date, catch count by insect group, glue board change |
Is the unit placed away from open product and exposed ingredients? |
| Pheromone trap |
Dry goods, ingredient, and packaging storage |
ID, target species, lure change date, count per check |
Are stored product insects trended separately? |
| Bird and exclusion points |
Roof lines, dock doors, open vents |
Proofing status, gaps found, repair date |
Is structural proofing tracked as closely as devices? |
Keep the register tied to change control, so that a new line, a relocated rack, or a rebuilt dock door automatically triggers a review of device placement.
Compare Your Current Device Map With What the Floor Actually Looks Like
Bring your latest site plan and service reports, and iFactory AI will show you where coverage, numbering, and check history do not line up.
TRAP-CHECK SCHEDULE
Frequency Is a Decision You Document, Not a Number You Copy
There is no single correct interval for every device. Frequency should follow a documented risk assessment, with higher-risk zones such as intake and ingredient storage checked more often than low-risk areas.
Device group
W1
W2
W3
W4
W5
W6
W7
W8
Check completed on time
Missed, reason and make-up check required
A flagged gap with a documented reason and a make-up check is far stronger evidence than a perfectly filled sheet nobody believes. The point of scheduling is to see misses early, while they are still easy to explain.
Risk Raises Frequency
Doors to the outside, waste handling, and open ingredient storage justify tighter intervals than closed finished goods racking.
Activity Changes the Plan
A device that records a catch should move to a more frequent check until the cause is understood and closed.
Seasons Shift the Load
Summer insect pressure and autumn rodent movement are predictable, so the schedule should anticipate them.
TRENDING
Turn Counts Into a Signal Someone Acts On
A raw count only becomes useful when it is compared with an earlier period and a written trigger. Trending is where records stop being history and start being control.
Illustrative monthly activity at one dock zone
In this example, no single month looks alarming until the pattern is plotted, and the rise from April onward would have been missed by anyone reading each report in isolation.
By Device
Repeated activity at the same device points to a nearby entry route, harborage, or sanitation issue.
By Zone
Clusters inside one area show where proofing, housekeeping, or storage practice needs attention.
By Species
Flying insects, stored product insects, and rodents have different causes and need separate trend lines.
By Season
Year-on-year comparison separates normal seasonal pressure from a genuine change in site conditions.
CORRECTIVE ACTION
From Finding to Verified Closure in Five Steps
The strongest pest records show a clear path from detection to effectiveness check. Auditors follow one finding through the whole chain, so every link has to be there.
1
Detect and Log
Activity is recorded against the exact device, date, and finding, with the technician identified.
2
Assess Against the Trigger
The result is compared with the written threshold, which decides whether it is a note, an action, or an escalation.
3
Find the Root Cause
The team looks for the entry route, harborage, or food source rather than only removing the pest that was caught.
4
Assign and Fix
An owner and due date are set, and the fix, whether proofing, cleaning, or treatment, is recorded with evidence.
5
Verify Effectiveness
Following checks confirm activity has dropped, and only then is the action closed.
When this chain lives in one system, overdue actions become visible to production, quality, and engineering at the same time. That shared visibility is usually what moves a stalled proofing job forward, and you can ask the iFactory AI team how action tracking is configured for multi-site operations.
CHEMICALS AND CONTRACTORS
The Two Record Sets Retailers Check Most Closely
Pesticide use and contractor control carry real food safety and legal weight, so inspectors tend to sample them early in a visit.
Treatment and Chemical Records
Product name, active ingredient, and approved use status
Date, time, area treated, and quantity applied
Applicator name and qualification
Current label and safety data sheet on file
Controls to protect product, packaging, and equipment
Storage and stock reconciliation where chemicals are kept on site
Contractor Control Records
Valid license and insurance, with expiry dates tracked
Written scope of service and visit frequency
Technician sign-in and site induction records
Service reports received within an agreed time
Annual review of contractor performance
Escalation contact for urgent activity
Expiring licenses and insurance certificates are among the easiest findings to prevent. A reminder tied to the expiry date removes the risk entirely.
PAPER VERSUS DIGITAL
What Changes When Pest Records Leave the Binder
Paper can pass an audit, but it is slow to search, easy to back-fill, and almost impossible to trend across sites. A digital record set removes those weaknesses without changing how technicians work.
Paper Binder
Device list updated by hand and often out of date
Missed checks found weeks later, if at all
Trend charts built manually before audits
Actions tracked in email and spreadsheets
Evidence searched by flipping pages
iFactory AI Digital Records
Live device register tied to the site map
Missed checks flagged the same day
Trends calculated continuously by device, zone, and species
Actions with owners, due dates, and closure evidence
Any record retrieved in seconds during an inspection
The practical benefit shows up on audit day, when a question about a device from eleven months ago takes seconds to answer rather than an afternoon.
INSPECTION READINESS
An Eight-Point Check You Can Run Before the Next Visit
This short checklist surfaces the gaps that cause most findings. Answer honestly, and treat every unchecked item as the next improvement.
Every device appears on a current site map with a unique ID.
Check frequency is justified by a written risk assessment.
Missed checks are recorded with a reason and a make-up date.
Action triggers are written down for each pest group.
Trend reports are reviewed monthly and signed off.
Every corrective action has an owner, due date, and closure proof.
Chemical labels, safety data sheets, and applicator records are current.
Contractor license and insurance dates are tracked with reminders.
Plants that tick six or fewer are usually carrying more audit risk than they realize, and a structured review is the fastest way to prioritize the work, so it can help to score your site against this list with a specialist before the auditor does.
ROLLOUT
How iFactory AI Brings Pest Records Under Control
The rollout starts from what you already have, including contractor reports, spreadsheets, and site plans, and builds the connected record set around it.
Weeks 1-2
Map and Import
Site plans, device lists, and past service reports are loaded and reconciled against the floor.
Weeks 3-4
Schedule and Triggers
Risk-based check intervals and written action triggers are configured for each zone and pest group.
Weeks 5-6
Trending and Actions
Trend views go live, and corrective actions are linked to owners and due dates.
Week 7 onward
Audit Pack and Review
The six-tab record pack is generated on demand, with monthly reviews built into the calendar.
FREQUENTLY ASKED QUESTIONS
What FMCG Quality Teams Ask About Pest Control Records
How long should pest control records be kept?
Retention is set by your certification scheme, retailer codes, and local regulation, and many plants keep records for at least the shelf life of the product plus a safety margin. Your written procedure should state the period clearly. If you want help aligning it to your scope,
ask the support team about retention settings.
Do digital records satisfy GFSI auditors?
Yes, provided they are controlled, dated, attributable to a named person, and retrievable on request. Auditors care about the integrity of the record rather than the medium. A good system also keeps a change history, which is stronger evidence than handwritten sheets. You can
see the audit trail in a live walkthrough.
Can we keep our current pest contractor?
Yes. iFactory AI works alongside your existing provider and ingests their service data, so you keep one relationship while gaining a single record set that you control. The contractor still performs the service, while your team owns the trends and actions.
Talk through contractor data sharing with support if you need details.
How are multiple plants handled?
Each site keeps its own device map, risk assessment, and triggers, since a bakery and a beverage line face different pressures. Results roll up into a portfolio view for corporate quality teams, who can compare sites on the same basis.
Explore the multi-site view with a specialist using your own plant list.
What happens to activity that does not fit a pattern?
Unusual findings are never hidden or auto-closed. They are logged, flagged for review, and routed to a named owner so that a new type of problem gets human attention. Over time these cases refine the trigger rules for similar situations.
Contact the iFactory AI team about review workflows if you need examples.
AUDIT-READY EVERY DAY, NOT ONCE A YEAR
Give Your Quality Team One Pest Record Set They Can Defend
iFactory AI connects device inventory, check schedules, trending, and corrective actions so your pest control records answer the auditor before the question is finished.