A packaging line can run for months without a serious fault, then lose a shift to a failed seal bar or a worn filler valve. Sensor alarms usually fire after the damage is visible. A digital twin gives the same sensor data a reference for how the machine should be behaving right now, so small drifts show up weeks earlier. Plants exploring this route can ask iFactory AI how twin data feeds a failure model.
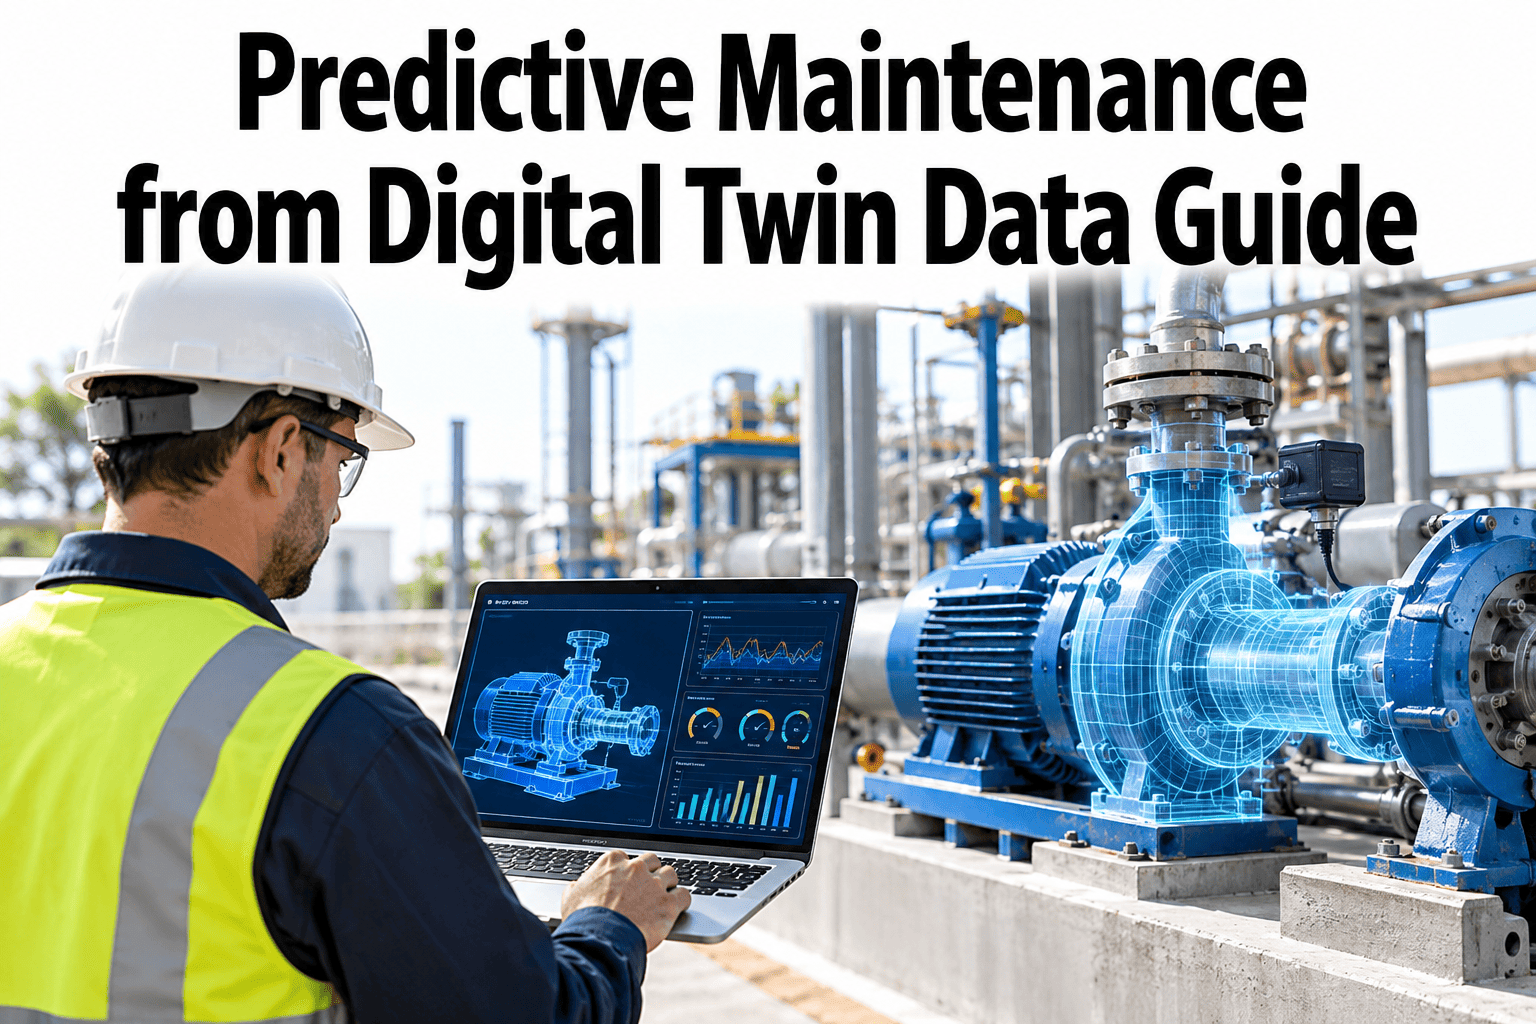
Predictive Maintenance from Digital Twin Data Guide
Turn raw line signals into twin-based features that separate real wear from normal changeover noise. iFactory AI pairs a digital twin with virtual line testing to train and prove fault prediction.
Why Raw Sensor Data Alone Falls Short
Raw signals are honest, but they are noisy and they carry no context. A motor drawing more current might be wearing out, or might simply be running a heavier product. A model that cannot tell the difference either misses faults or raises false alarms.
Few failures to learn from
Well-run lines fail rarely, so labelled failure examples are scarce. A model trained on a handful of events learns little.
Constant operating change
Changeovers, new SKUs, speed changes and cleaning cycles move every signal. Fixed limits flag these as faults.
Slow drift hides in noise
Wear often shows as a few percent of drift over weeks. That is smaller than the swing between normal runs.
A twin addresses each of these. It supplies an expected value for the current operating state, so what remains after subtracting it is the part that should not be there.
How the Twin Feeds the Failure Model
The twin sits between the sensors and the prediction model. It does not replace machine learning. It prepares better inputs for it.
The idea has research support. Kapteyn and Willcox describe building a twin from a library of physics-based models, simulating sensor readings for each, and training an interpretable classifier that picks the model matching the real asset. Their demonstration was on a small aircraft, not a packaging line, so treat it as a method reference, not a plant result.
Twin-Derived Features for FMCG Lines
A feature is a number the model learns from. Twin-derived features describe the difference between expected and actual behaviour. The list below shows common examples for filling and packing lines.
| Asset | Raw Signal | Twin-Derived Feature | Fault It Helps Reveal |
|---|---|---|---|
| Filler valve | Flow and cycle time | Flow residual against expected for the product and fill speed | Seat wear and slow closing |
| Capper head | Applied torque | Torque deviation from the expected curve for that closure | Clutch wear and misalignment |
| Sealer jaw | Jaw temperature and dwell | Heat-up gradient compared with the twin's thermal model | Heater degradation and film contamination |
| Conveyor drive | Motor current | Load residual after removing product weight and speed effects | Bearing wear and belt tension loss |
| Labeller | Vibration and reject count | Vibration normalised by speed and label stock | Roller wear and peel-plate fouling |
Actual minus expected
The core twin feature. A growing residual means the machine is drifting from its own healthy behaviour.
Mode and product tags
Product, speed, recipe and cleaning state are added, so the model never compares unlike conditions.
Test Twin Features on Your Own Line
Book a 30-minute session and iFactory AI will show how residual features are built from line signals and compared with raw data on realistic FMCG examples.
A Residual Example: Eight Weeks of Drift
The bars below show an illustrative conveyor drive. Each bar is the gap between actual motor current and the twin's expected current, as a percentage. Changeovers swing raw current by about 10 percent, which hides the early trend.
Twin alert: week 5
A residual limit of 5 percent is crossed in week 5. The alert opens a planned inspection with three weeks in hand.
Raw limit: week 8
A fixed raw limit wide enough to ignore changeover swings would only fire once drift passed 15 percent, in week 8.
Lead time gained
In this illustration, three weeks. The figure is an example, so measure lead time on your own history.
Virtual Line Testing: Train on Faults You Have Not Had
Real failure data is thin. A twin can simulate a fault at several severity levels, produce the sensor patterns that fault would cause and add them to the training set. The published study did this with a library of 25 models, built from five stiffness levels in each of two damage regions.
Each cell is a simulated machine state with its own sensor pattern. The grid above is an illustrative 25-state library for a packing line. Simulated states supplement real history, they never replace it.
Proving the Improvement on Your Own Plant
Claims about better prediction accuracy mean little until they are measured on your lines. Run a fair test where raw-only and twin-based models see the same data and are scored on events they never saw during training.
| Measure | What It Answers | Why It Matters | Compare |
|---|---|---|---|
| Recall | What share of real failures were flagged? | Missed failures cause unplanned stops | Raw model against twin model |
| Precision | What share of alerts were real? | False alarms erode trust | Raw model against twin model |
| Lead time | How early was the first correct alert? | Sets how well repairs can be planned | Median days before failure |
| False alarms per month | How many alerts led nowhere? | Decides workload for technicians | Per asset class and per line |
FMCG Conditions That Make the Twin Worth It
High-volume consumer goods lines change state far more often than most process plants. That is where a reference model earns its place.
These conditions also explain why plain threshold alarms struggle. A limit set for one product is wrong for the next, and setting a hundred limits by hand is not practical.
Common Mistakes When Using Twin Data for PdM
Most problems come from the data around the model, not the model itself.
From Alert to Work Order
A prediction only pays when it becomes a job done at a good time. Define the path from alert to repair before the model goes live.
The feedback step is the one most plants skip. Without confirmed outcomes the model cannot learn which alerts mattered, and precision stops improving.
Data Readiness: What to Gather First
A twin-based pilot can start with modest data. Gaps matter less than knowing where they are.
| Data Set | Minimum for a Pilot | Common Gap | Quick Fix |
|---|---|---|---|
| Sensor history | Several months at steady sampling | Missing or irregular timestamps | Resample to a common interval |
| Product and speed records | Every run with start and end | Manual logs not matched to time | Pull from the line controller |
| Failure history | Dates, assets and causes | Free-text work orders | Code causes from a short list |
| Asset specifications | Ratings and key dimensions | Missing for older machines | Use nameplate and manuals |
| Maintenance actions | Repairs and part changes | Not dated precisely | Record on close-out |
Rolling Out Twin-Based Prediction in 90 Days
iFactory AI is built as a turnkey server that racks in, plugs in and goes live in roughly 6 to 12 weeks, so a focused pilot fits inside a quarter.
What iFactory AI Adds
iFactory AI is smart manufacturing and industrial software. Its Digital Twin and Virtual Line Testing features support this workflow.
Where Twin-Based PdM Fits Among Maintenance Strategies
Twin-based prediction is one tool in a mix. Use it where its strengths match the asset, and keep simpler methods where they are enough.
| Strategy | Triggers Work When | Strength | Weak Spot | Best For |
|---|---|---|---|---|
| Run to failure | The asset stops | No planning effort | Unplanned downtime | Cheap, non-critical items |
| Calendar PM | A fixed date passes | Simple and auditable | Over- or under-servicing | Wear that follows time |
| Threshold monitoring | A signal crosses a limit | Fast to set up | Fires late or falsely | Stable, single-mode assets |
| Twin-based PdM | Residual drift shows a developing fault | Handles changing conditions | Needs calibration and data | Critical, variable-load assets |
Most plants end up blending all four. The aim is to give each asset the lightest method that still protects the line, so effort goes where a surprise stop costs the most.
What a Prevented Stop Is Worth
Business cases for predictive maintenance are easiest when the maths is shown plainly. The receipt below uses illustrative figures for one filler line, so replace each value with your own.
A planned repair of the same fault might cost 700 and take 90 minutes in a changeover window. The difference, about 3,200, is what one correct early alert is worth. Multiply by the number of alerts you expect to act on each year, and subtract the cost of false alarms, to estimate the value of the programme.
Count false alarms
Each wasted inspection costs technician time. Include it so the case stays honest.
Count quality effects
Worn parts often cause underfills and rejects before they cause a stop. Add that avoided scrap.
Count spare parts
Early warning lets you order parts normally instead of paying for express delivery.
Alert Tiers: Match the Response to the Residual
Not every drift needs the same response. Tiered alerts keep technicians focused and stop low-level signals from becoming noise.
Set the band edges from your own healthy data. The examples above are illustrative and should be adjusted for each asset, since a filler valve and a conveyor motor drift at very different speeds.
Keeping the Model Healthy Over Time
A twin and its model are not set-and-forget. Machines get overhauled, products change and sensors age, so both need regular care.
Plain-Language Glossary
Shared words keep reliability and operations teams aligned.
Frequently Asked Questions
How much better is prediction from twin data?
It depends on the asset, the data and the baseline. Published methods show the approach, but gains must be measured on your own held-out failures before you rely on them.
Do we need years of failure history?
Not always. Simulated fault states can add coverage where history is thin. Ask support what history your assets need for a first pilot.
Does a twin replace condition monitoring?
No. It builds on it. Sensors still supply the measurements, and the twin supplies the expected values to compare them with.
Which FMCG assets are best to start with?
Start with assets that cause costly stops and have usable signals, such as fillers, cappers, sealers and conveyor drives. Pick three at most.
How do we keep false alarms low?
Use context-aware residuals, tune limits on held-out data and feed confirmed outcomes back after every inspection.
Predict Faults Before the Line Stops
iFactory AI pairs a digital twin with virtual line testing to build features that separate wear from noise. Book a walkthrough on your own FMCG line data.