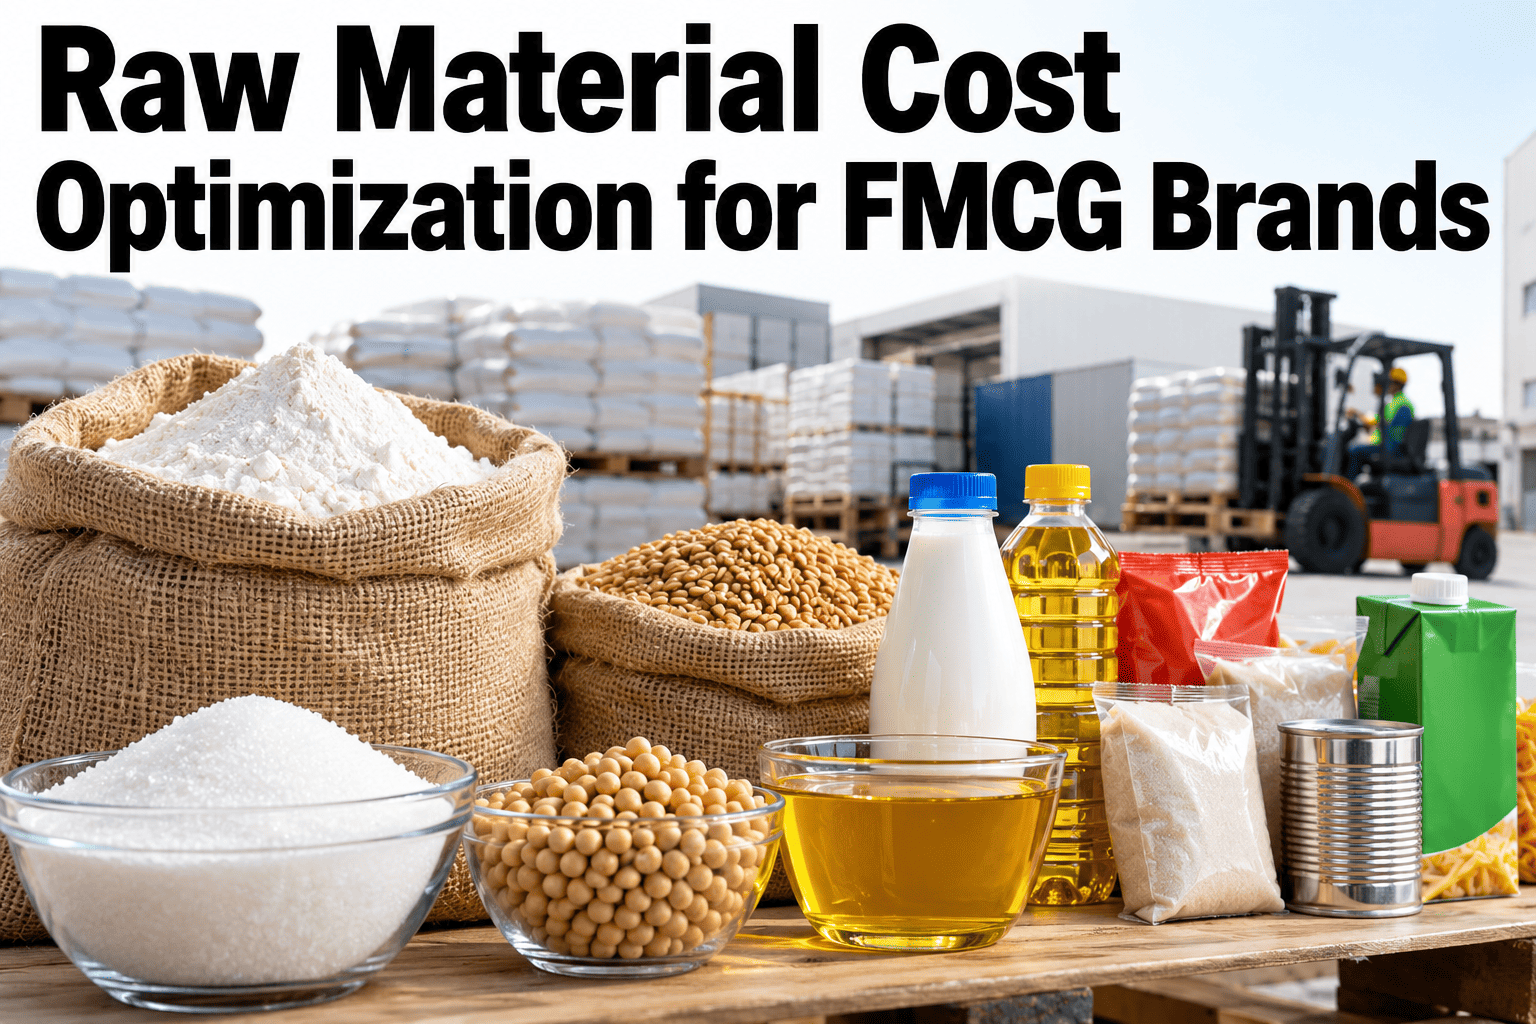
Raw materials are often the largest variable cost in an FMCG unit, yet the levers that move it sit with different teams. Buyers chase price, R&D guards the spec, plants watch yield and finance owns the hedge book. When each team optimizes alone, negotiated savings rarely reach the margin line in full. Brands that want all four levers on one live cost view can walk through a unit-cost margin review with iFactory.
Make Every Dollar of Material Spend Land in Margin
iFactory AI joins price, spec, yield and hedge data for each unit you ship, so buyer savings reach the margin line instead of fading on the plant floor.
Why Material Cost Cannot Wait in 2026
Input prices are not moving together. Cocoa fell hard from its record, while sugar, palm oil, packaging resin and crude-linked inputs stayed under pressure for many consumer brands. A plan built on one commodity story breaks the moment another one turns.
Cocoa futures record per tonne, set in December 2024.
Cocoa level reported in early 2026 after the sharp fall.
Direct material savings food players have reported from spec and sourcing work, per the McKinsey Food Institute.
Where 100 of Material Budget Quietly Goes
Cost reviews often stop at the purchase price. The bigger story is every step after the invoice. The funnel shows an illustrative path where 100 of material budget becomes 76 of sold product value.
Four Levers That Move Material Cost
Not every lever pays back on the same clock. Plant-controlled levers can show results within weeks. Market-dependent levers take longer but protect larger volumes.
Yield and Giveaway
Tighten fill weights, trim start-up loss and track every kilo from receiving to pack. Results show up in weeks.
Supplier Consolidation
Move spend to fewer qualified suppliers and rebid on landed cost, not the quoted price.
Spec Optimization
Right-size tolerances, grades and pack specs to what the shopper can actually notice. Needs QA and R&D sign-off.
Hedging and Indexation
Layer cover and index-link contracts so price swings stop landing on a single quarter of margin.
Supplier Consolidation Without Losing Resilience
Fewer suppliers can lift volume leverage and cut the time spent managing contracts. The risk is dependency, so critical inputs keep a qualified backup. Buyers can compare supplier landed cost on real batches in a short session.
Judge Suppliers on Landed Cost, Not the Quote
The cheapest quote can be the costliest good kilo once your own line yield is counted. The grid divides price by yield.
| Supplier | Quoted price per kg | Yield on your line | Landed cost per good kg | Read-out |
|---|---|---|---|---|
| Supplier A | $1.00 | 92% | $1.087 | Solid and steady |
| Supplier B | $0.95 | 85% | $1.118 | Cheapest quote, highest cost |
| Supplier C | $1.03 | 95% | $1.084 | Lowest landed cost |
Spec Optimization: Pay Only for What Shoppers Notice
A spec is a promise to the customer and a cost to the plant. Over-tight tolerances shrink the supplier pool and lift the price with no gain a shopper can detect. The bands show an illustrative gap.
Grade and Purity
Ask whether a higher grade changes the finished product or only the invoice.
Size and Moisture
Wider particle or moisture windows open the supplier pool and ease pricing.
Packaging Gauge
Film thickness, board weight and closure design each carry hidden cost.
Recipe and Pack Size
Some chocolate makers cut cocoa content or moved to smaller packs when cocoa spiked.
Map
List every spec limit and its cost.
Test
Run sensory and shelf tests.
Quantify
Model cost and yield effects.
Pilot
Run one line for one month.
Lock
Revise the spec and the contract.
Yield and Giveaway: The Fastest Savings Inside the Plant
Giveaway is product filled above the label or customer target. It hides inside averages, so plants rarely see it. A tighter process lets the target move closer to the label while staying compliant. Operations leaders can see giveaway by line and shift on their own data.
Annual material value on 10,000 tonnes at $1.50 per kg
Giveaway removed by tighter fill control
Saved every year on that one line
Follow the Kilo Through Five Stations
Short weights and moisture that differs from the certificate.
Shrink, spoilage and spillage while waiting for the line.
Start-up, changeover and trim loss at every product switch.
Overfill, underweight rework and packaging rejects.
Damage, held lots and returns that reverse the sale.
See Your Leaks by SKU, Shift and Supplier
Book a 30-minute session and iFactory AI will show material cost against standard for your own products.
Hedging and Pricing Mechanisms That Protect Margin
Hedging does not lower the average price of an input. It reduces the surprise. Layered cover, built in steps across several quarters, avoids betting a whole year on one price. Finance teams can ask about hedge exposure reporting before planning cover.
| Instrument | How it works | Best fit | Trade-off |
|---|---|---|---|
| Forward contract | Fixes price and volume with a supplier for later delivery | Steady-volume inputs such as sugar or oils | Locks the price even if the market falls |
| Futures | Exchange contract to buy at a set price on a set date | Benchmarked inputs with liquid markets | Margin calls and basis risk |
| Options and collars | Pay a premium for a price ceiling, sometimes with a floor | Volatile inputs and uncertain volumes | Premium cost and capped upside |
| Index-linked clause | Price follows a published index plus a fixed margin | Packaging resin and other inputs without liquid futures | Still moves with the index |
Know Which Inputs Drive Your Category
Cost pressure differs by category. Food brands lean on sugar, edible oils, wheat, cocoa and dairy. Home and personal care lean on palm derivatives, packaging and crude-linked chemicals. The heat grid shows an illustrative exposure.
Packaging Is Raw Material Too
Ingredients get the attention, but packaging and crude-linked inputs form a large block of the basket. CRISIL's May 2026 view puts crude-linked inputs, including packaging, at 25 to 30 percent of total raw material cost for organised FMCG players.
Gauge and Weight
Thinner film or lighter bottles cut resin per pack. Test seal strength and impact resistance before any change.
Format Consolidation
Fewer pack formats mean larger orders per supplier and fewer changeovers on the line.
Index-Linked Pricing
Tie resin and board prices to a published index so you can see what is market and what is margin.
Pack Reject Control
Every rejected pack wastes the film and the product inside it. Track both together.
Currency and Freight: The Hidden Multipliers
For brands that import inputs, a weak local currency adds a second hit on top of global price moves. Analysts covering Indian FMCG described this double effect on palm oil, crude derivatives and specialty chemicals in mid-2026. Procurement can ask support about landed cost in local currency to see both effects together.
A Composite Scenario: One Snack Line, One Quarter
A snack brand put its top five inputs and its busiest line under one cost view. The bars show an illustrative saving of 6.3 index points on a material cost base of 100.
Seven Mistakes That Erode Savings
Most programs lose value in the handover between teams. These patterns show up again and again.
The Material Cost Dashboard: What to Track
A short list of measures beats a long one. These six give procurement, plants and finance a shared language. Plant and finance leads can view these measures on a live dashboard during a short session.
| Measure | How it is calculated | Primary owner | Review rhythm |
|---|---|---|---|
| Material cost per unit | Total material spend divided by good units shipped | Finance | Weekly |
| Price variance to index | Paid price minus published index price | Procurement | Monthly |
| Material yield | Good output weight divided by input weight | Operations | Daily |
| Giveaway rate | Average fill weight above label, as a percentage | Quality | Per shift |
| Hedge coverage | Covered volume divided by forecast volume | Treasury | Monthly |
| Verified saving | Baseline cost minus actual cost, same volume and mix | Finance | Monthly |
Who Owns Which Lever
Savings stick when each lever has a named owner and each owner sees the same numbers. The cards show a common split of ownership.
Price and Supplier Mix
Owns rebids, consolidation and index clauses. Needs landed cost by supplier, not only the quote.
Spec and Recipe
Owns tolerances, grades and claims. Needs a cost model for each proposed change.
Yield and Giveaway
Owns changeovers, fill control and rework. Needs batch and shift loss in plain numbers.
Hedge and Verification
Owns cover policy and the savings ledger. Needs exposure by input and quarter.
A 90-Day Plan to Start Saving
Start narrow, prove the number, then widen. Each phase ends with a saving that finance can verify.
Baseline
Act
Lock In
Where iFactory AI Fits
Price lives in ERP and procurement, weights live on the line and yield lives in batch records. iFactory AI joins them in its Cost Reduction Platform and Margin Analytics views, so every team reads one number.
Cost-to-Standard Variance
Compare actual material cost with standard by SKU, batch and shift.
Landed Cost Scorecards
Rank suppliers on price, yield, on-time delivery and spec conformance.
Yield and Giveaway Tracker
Follow each kilo from receiving to pack and flag the stations that leak.
Spec Impact What-If
Model the cost and yield effect of a spec change before any pilot.
Hedge Exposure View
Show open exposure by input and quarter for finance and buyers.
Verified Savings Ledger
Check each saving against a baseline so finance can sign it off.
Frequently Asked Questions
How much can raw material cost optimization save an FMCG brand?
It depends on the category and the starting point. The McKinsey Food Institute reports 2 to 6 percent on direct materials from spec and sourcing work across food players. Plant-level yield work adds to that because it reduces the volume you must buy. Support can explain how baselines are set so every saving can be verified.
Is supplier consolidation risky for critical ingredients?
It can be when it leaves a single point of failure. Consolidate the long tail of overlapping, low-risk items first and keep two qualified sources for inputs that can stop a line. Scorecards that track delivery and spec conformance show early warning signs, so a weak supplier is found before it hurts a launch.
Can spec optimization change taste or quality?
It can, which is why changes are tested instead of assumed. Start with limits tighter than shoppers can detect, run sensory or shelf tests and get QA approval before a pilot. A what-if model shows the cost effect first, so only worthwhile changes reach testing. See a spec what-if on your own SKUs in a short walkthrough.
Does iFactory AI place hedge trades?
No. Hedge decisions stay with finance and treasury under your own policy. iFactory AI shows open exposure by input and quarter, joins it with production plans and flags where cover and volume no longer match. That gives treasury a cleaner basis for decisions without replacing their judgment.
What data do we need to start?
Purchase prices and invoices, receiving weights, batch records, bills of materials and checkweigher readings are the core. Most brands already hold these in ERP and MES systems. The first weeks of rollout match records by batch and SKU, so the cost stack can be built cleanly.
Turn Material Savings Into Reported Margin
iFactory AI links price, spec, yield and hedge data so each saving reaches the margin line. Book a walkthrough to see it on your own SKUs.