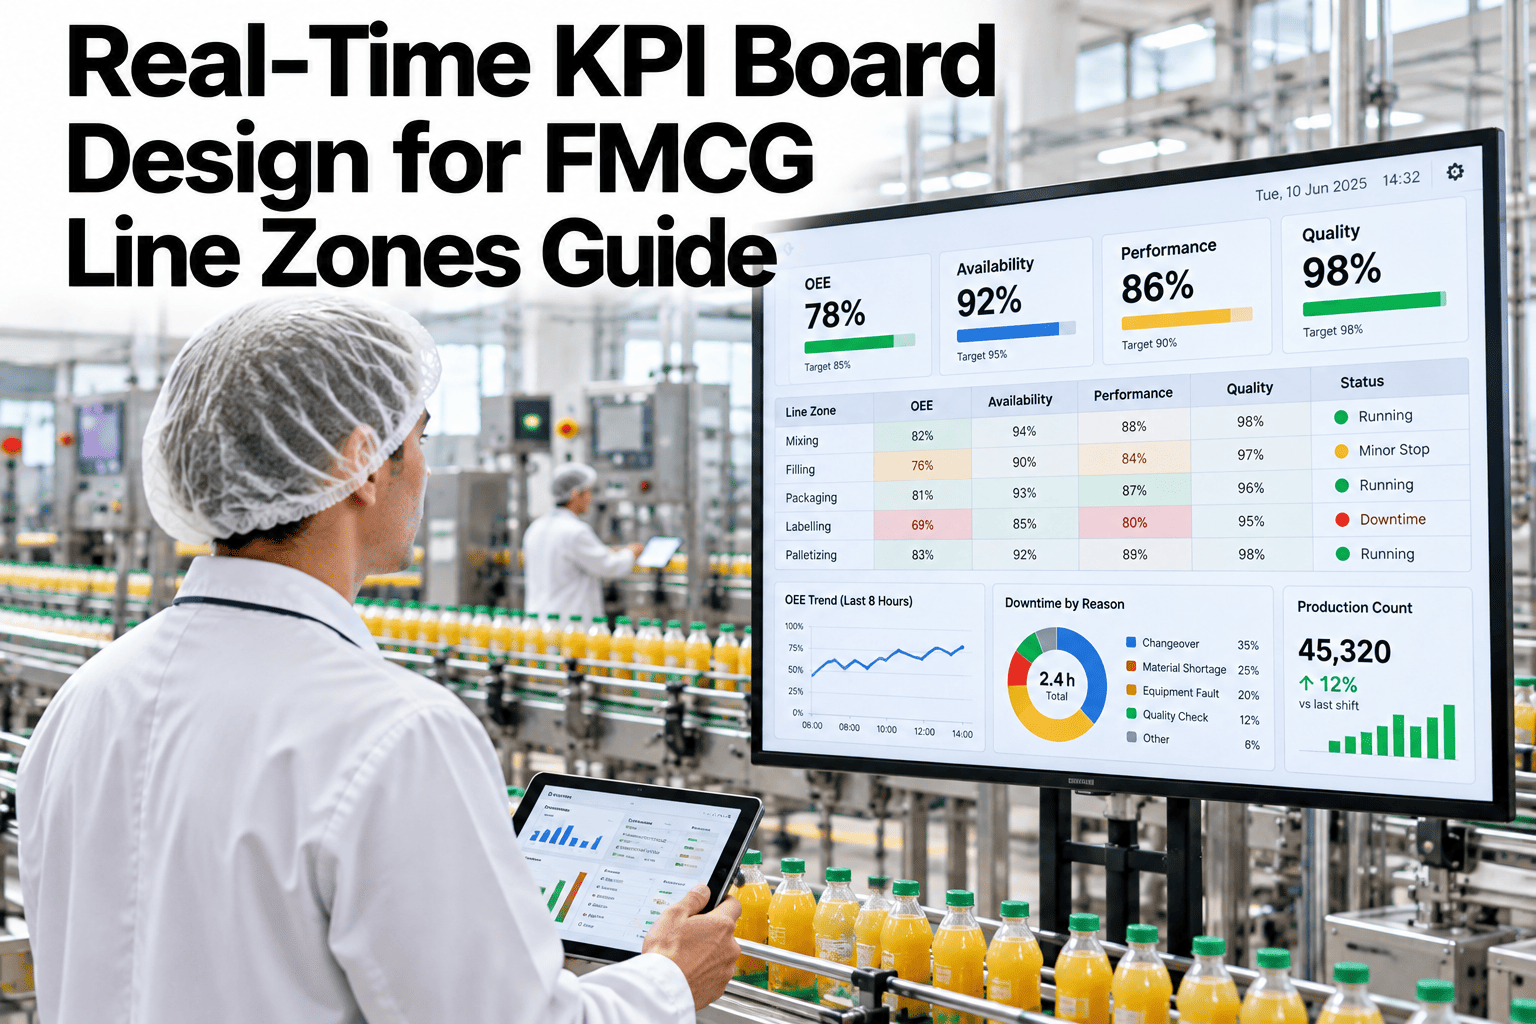
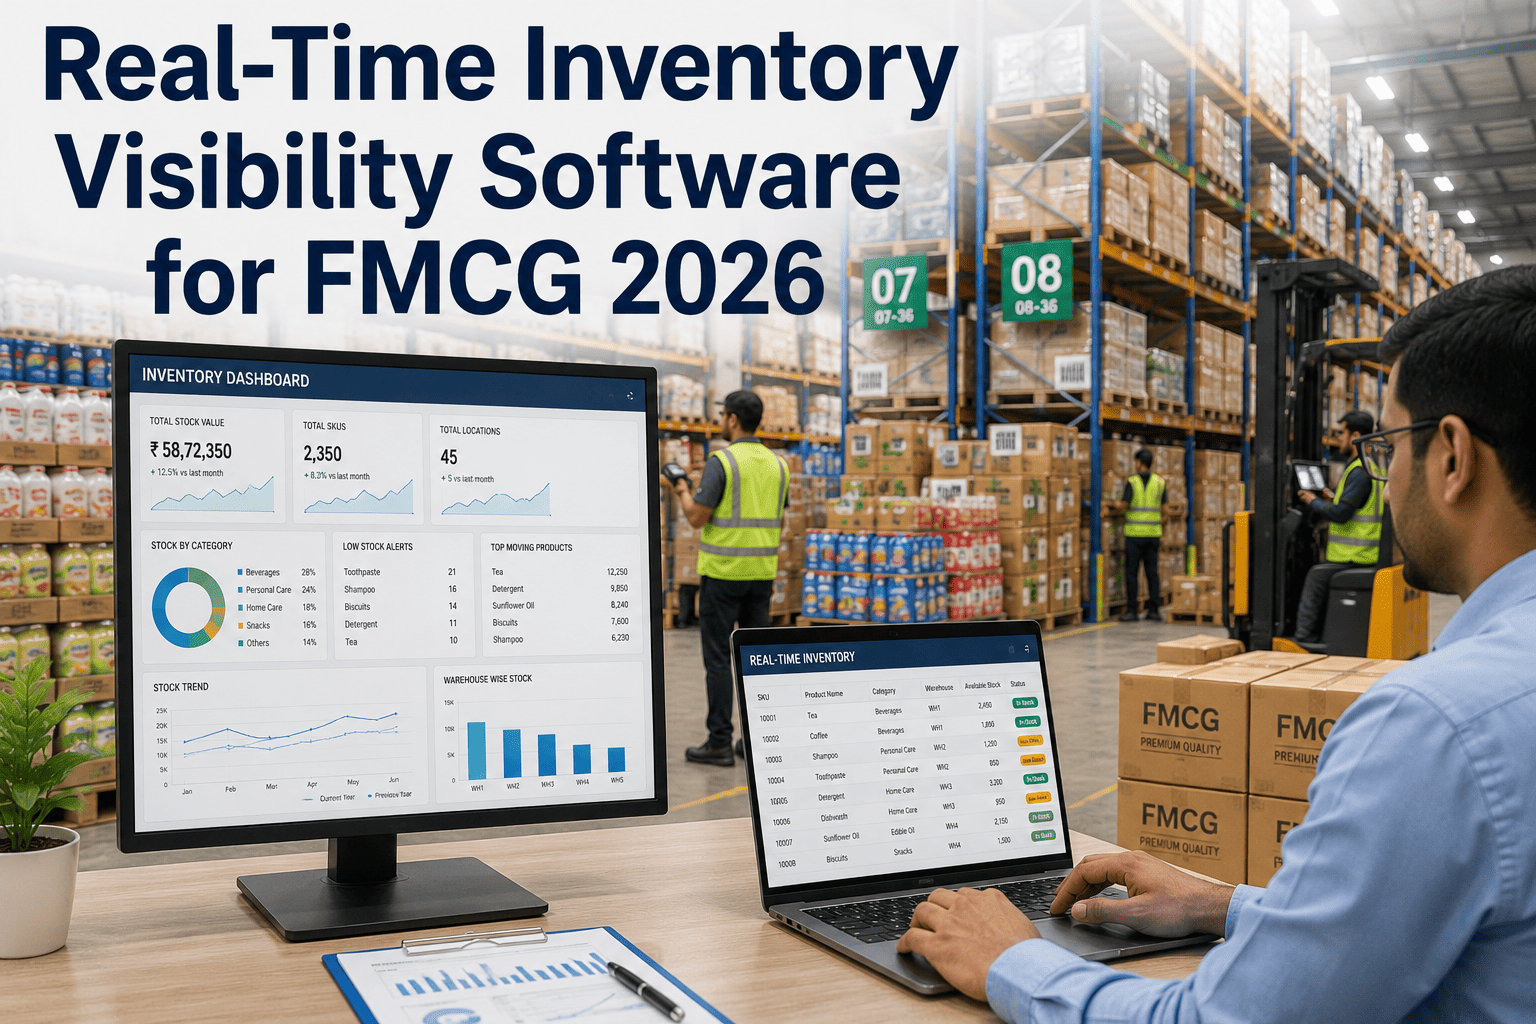
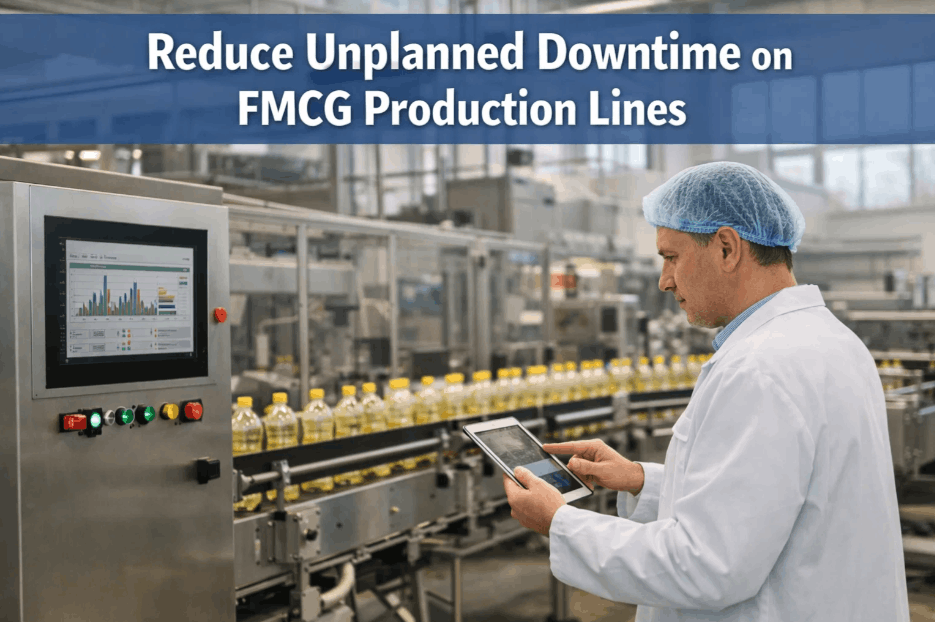
A floor display should answer one question in about three seconds: are we on track right now? Many boards fail because they show too many numbers, update too slowly or hang where nobody can read them. Good KPI board design for FMCG line zones picks a few measures, shows them against clear targets and refreshes at a pace operators can act on. To see how a board could look on your own lines, you can preview a zone display with our team.
Real-time reporting for FMCG line zones
Design Floor Displays Operators Can Read in Three Seconds
iFactory AI helps FMCG plants build zone KPI boards with the right measures, clear layout and sensible refresh rates, so operators stay oriented without pulling reports.
Illustrative hourly output against target
Three-second testFour Questions a Zone Board Must Answer at a Glance
Operators glance at a board between tasks. It has to answer the basics without reading or walking closer.
Am I on target?
Output against plan for this hour or shift
Is quality fine?
Reject rate and any quality alerts
Why are we stopped?
Current stop reason and its duration
What is next?
Next changeover, order or message
If a number on the board does not help answer one of these questions, it probably belongs on a report instead.
Choosing KPIsSix Measures That Earn a Place on the Board
Less is more. Four to six measures are usually enough for a line zone.
Output against target
Units produced versus plan for the current period.
Reject rate
Share of units rejected, shown with a limit.
Stops and reasons
Current stop reason with a running timer.
Speed or rate
Actual line speed compared with rated speed.
Changeover timer
Time elapsed against the planned changeover.
Message line
One line for safety notes or priority instructions.
Choose measures operators can influence in the next hour. Monthly metrics belong in meetings, not on the floor.
LayoutBuild the Screen in Four Layers of Importance
Headline number
The single figure that shows whether the zone is on track.
Trend
A short history so operators see direction, not only value.
Stop and quality status
The current stop reason or active quality alert.
Messages
Brief notes from supervisors, kept to one or two lines.
Do not rely on colour alone. Pair status colours with words or shapes so colour-blind operators read the board correctly.
Preview a Board Built for Your Line Zones
Share your line layout and current measures and see how iFactory AI would turn them into a clear, readable zone display.
Refresh cadenceUpdate Each Measure at the Pace Operators Can Act On
Faster is not always better. A number that flickers every second is hard to read and hard to trust.
| Measure | Suggested refresh | Reason |
|---|
| Line speed and status | Every few seconds | Operators react quickly to stops |
| Output against target | Every minute | Smooth enough to read, fast enough to act |
| Reject rate | Every one to five minutes | Needs enough units to be meaningful |
| Stop reason | As soon as entered | Supports fast follow-up |
| Shift summary | At shift change | Used for handover, not live action |
Show the time of last update somewhere on the screen so everyone knows the data is live.
ReadabilitySize Text for the Distance People Actually Stand
A common rule of thumb is about 25 millimetres of character height for every three metres of viewing distance. Test with a real operator at the real position.
3 m
About 25 mm characters
6 m
About 50 mm characters
9 m
About 75 mm characters
12 m
About 100 mm characters
Use high-contrast text and avoid thin fonts. Keep the screen free of small print that nobody can read from the line.
PlacementMount the Board Where Work Actually Happens
Poor placement
Behind the operator's work position
Facing windows or bright lights
Too high or too low to read comfortably
Blocked by guards or stacked pallets
Good placement
Within the operator's natural line of sight
Shielded from glare and reflections
Mounted at a comfortable height
Clear of obstructions and safe to maintain
Walk the zone at different times and shifts before fixing the position. To plan placement for your floor, ask our team for a display placement checklist.
From zone to plantRoll Zone Boards Up Into Line and Plant Views
The same data should feed the floor display, the supervisor view and the plant overview, with more detail where it is needed.
Zone boardLine viewSupervisor phone
Shared real-time data layer
Plant overviewShift reportsManagement dashboards
RolloutPilot One Zone and Improve With Operator Feedback
Week 1
Pick one zone and agree the four to six measures with operators.
Weeks 2 to 3
Run the board and collect feedback on readability and usefulness.
Week 4
Adjust layout, then copy the design to other zones.
Operators involved in choosing measures
Four to six KPIs with targets
Viewing distance measured
Refresh times agreed
Status shown by words as well as colour
Owner for board content named
Expert reviewWhat a Lean Manufacturing Lead Would Check First
Expert review
A good board changes behaviour on the floor. If operators do not use it to make decisions, the design needs another look, no matter how attractive it is.
VerdictStrong when measures are few, current and owned by the zone team.
Watch forCrowded screens, small text and stale data.
Do nextPilot one zone and ask operators what they would remove first.
Frequently asked questionsWhat Teams Ask About KPI Board Design
How many KPIs should a zone board show?
Four to six is a good range for a line zone. Each extra number makes the board harder to read and pulls attention away from the measures that matter most. If a figure does not help an operator decide something in the next hour, it belongs in a report or a supervisor view instead.
See a sample board layout.
Should boards show OEE?
OEE is useful for managers, but operators find it easier to act on its parts, such as speed, stops and rejects. Many plants show the parts on the floor board and keep the combined OEE figure on supervisor and plant views. This keeps the board simple while keeping the overall picture available.
Ask about OEE display options.
How do we choose the right screen size?
Start from the real viewing distance and the character height people need to read from there, then choose a screen that supports it. Brightness matters too, since bright floors and windows can wash out weak displays. Test a sample screen at the actual position before buying many.
Review a sizing example.
Can the board show messages from supervisors?
Yes. A short message line works well for safety notes, priority orders and handover reminders. Keep messages brief, assign someone to clear old ones and avoid long paragraphs that nobody can read from a distance. Stale messages teach operators to ignore the whole board.
Ask about message features.
What happens if the data feed stops?
The board should show a clear no-data or stale-data status rather than the last known numbers, so operators do not trust figures that are no longer live. A visible last-updated time helps too, and an alert can notify the support team when a feed has been silent for too long.
Discuss data feed safeguards.
Clear numbers, faster decisions
Put the Right Numbers in Front of Every Operator
Book a session with iFactory AI to review your zones, choose the right measures and design floor displays that keep teams on target.