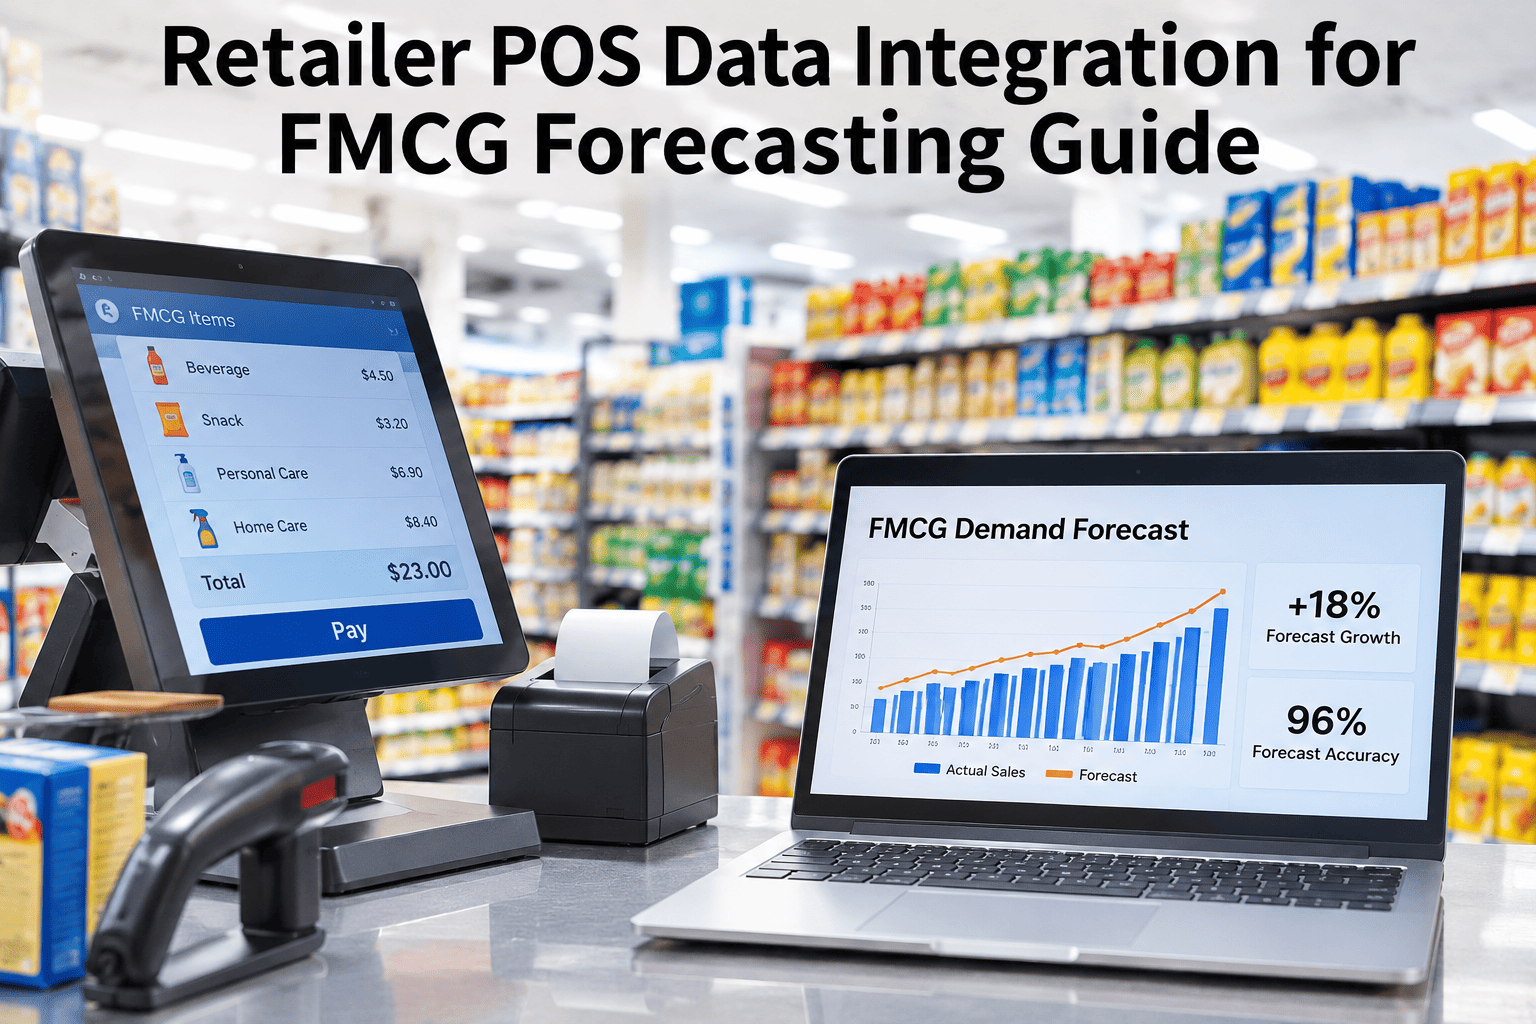
A forecast built only on what a brand ships to a distribution center is really a forecast of orders, not of what shoppers actually bought off the shelf — and the gap between the two is where most stockouts and overstocks are born. Retailer point-of-sale data, pulled from Walmart, Kroger, Target and other downstream partners, shows real shelf-level demand days or weeks before that demand shows up as a reorder. Syndicated data from providers like NielsenIQ and Circana adds market context on top, but arrives on its own slower cadence and in its own format. Feeding both into one forecasting model, instead of treating them as separate reports, is what lets a demand signal reach the plan while it still matters. Demand planning teams who want to see their own retailer feeds mapped into one model can walk through a POS data integration review with our team.
Let Shelf-Level Demand Reach the Forecast Before the Reorder Does
iFactory, an on-premise AI platform for FMCG demand sensing, pulls retailer POS feeds and syndicated data into one forecast ensemble, so a real demand shift reaches the plan in days, not weeks.
Why Does Demand Sensing Catch What Statistical Forecasting Misses?
Statistical forecasting methods look backward, fitting a model to historical shipment patterns at an aggregate level. Demand sensing looks at what is happening right now — POS sell-through, inventory position, promotional activity — and adjusts daily instead of waiting for the next planning cycle. Neither replaces the other; a forecast built only on history misses a real-time shift, while real-time signal with no historical grounding overreacts to noise. The two are meant to be combined, with the statistical baseline providing stability and the sensing layer providing speed. Ask our team how your current forecast balances the two.
What Each Data Source Actually Tells You
| Source | What it shows | Cadence |
|---|---|---|
| Retailer POS feed | Actual shelf-level sell-through, store by store | Daily to weekly, near real time |
| Syndicated data | Category share, competitor performance, pricing context | Weekly, delayed |
| Internal shipment data | What was actually shipped to the retailer or distributor | Real time within your own ERP |
See Where Your Shipment Data and POS Data Disagree
Share a recent SKU's shipment and POS history, and we will show where the two diverge.
Why Retailer Feeds Don't Just Plug Into Each Other
Each retailer and syndicated provider uses its own product hierarchy, its own SKU naming and its own category definitions, and none of them was built with the others in mind. Harmonizing them — mapping every retailer's SKU code to your own internal product ID — is the unglamorous work that has to happen before any of the data is actually usable in one forecast. Skipping this step is the most common reason a POS integration stalls after the initial data feeds are technically connected.
How a POS Signal Actually Reaches the Forecast
Retailer POS, syndicated and internal shipment feeds land in one pipeline.
SKU, hierarchy and cadence differences are reconciled.
Recent sell-through is compared against the statistical baseline.
The forecast updates, with the shift attributed to a specific signal, not a black box.
The Stockout That Shipment Data Never Saw Coming
A regional promotion drove a sharp rise in shelf-level sell-through at one retailer. The brand's internal shipment data stayed flat, since the retailer's existing inventory absorbed the first week of lift before placing a reorder — by which point the shelf had already been thin for days.
Why This Matters Most Across a Full Portfolio, Not One Product
A single SKU's stockout is a lost sale; the same pattern repeating across dozens of SKUs at once, during a seasonal push or a category-wide promotion, is a planning failure with a much larger cost. The value of connecting POS data compounds across a portfolio, because the harmonization work done once covers every SKU that flows through the same retailer feed afterward.
Retailer Feeds and Internal Data, in One Forecast Ensemble
Multi-Retailer POS Integration
Retailer POS and syndicated feeds are harmonized into one common SKU and category structure.
Demand Sensing Layer
Real-time sell-through is compared against the statistical baseline, daily.
ML Forecast Ensemble
Statistical and sensing signals are combined into one forecast, not two competing numbers.
Turnkey On-Premise Deployment
Retailer and internal data stay on your own server, with no outside cloud dependency.
What Demand Planners Ask About POS Data Integration
Do we need POS feeds from every retailer, or just the largest ones?
Most brands start with the retailers that represent the largest share of volume, since that is where the signal matters most, and expand coverage as the integration proves its value. Discuss which retailers to prioritize for your portfolio.
How is syndicated data different from direct retailer POS feeds?
Syndicated data from providers like NielsenIQ or Circana covers broader market context — category share, competitor pricing — while a direct retailer feed gives your own SKU-level sell-through at that specific retailer, and the two serve different questions. Ask support how both fit your model.
What happens when a retailer feed is late or incomplete?
A gap should be flagged and handled explicitly, either by falling back to the statistical baseline for that period or holding the forecast update, rather than silently treating missing data as zero demand. Discuss gap handling for your retailer feeds.
How often does the forecast actually update once POS data is connected?
Update frequency depends on how often each feed arrives, but demand sensing is generally built to refresh daily rather than waiting for a weekly or monthly planning cycle. Ask about update frequency for your specific feeds.
Can this work alongside our existing demand planning system?
Yes, demand sensing is typically built to feed an existing planning process with an adjusted forecast, rather than replace the planning system your team already uses. Ask how this fits your current planning tool.
Stop Forecasting the Order Instead of the Demand
See retailer POS, syndicated and shipment data combined into one forecast that updates while the signal still matters.