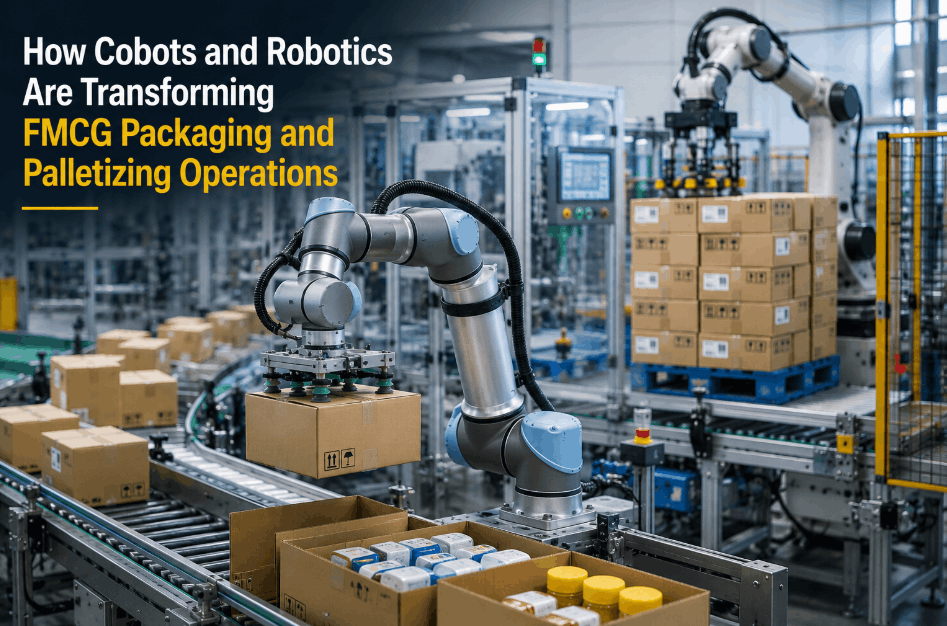
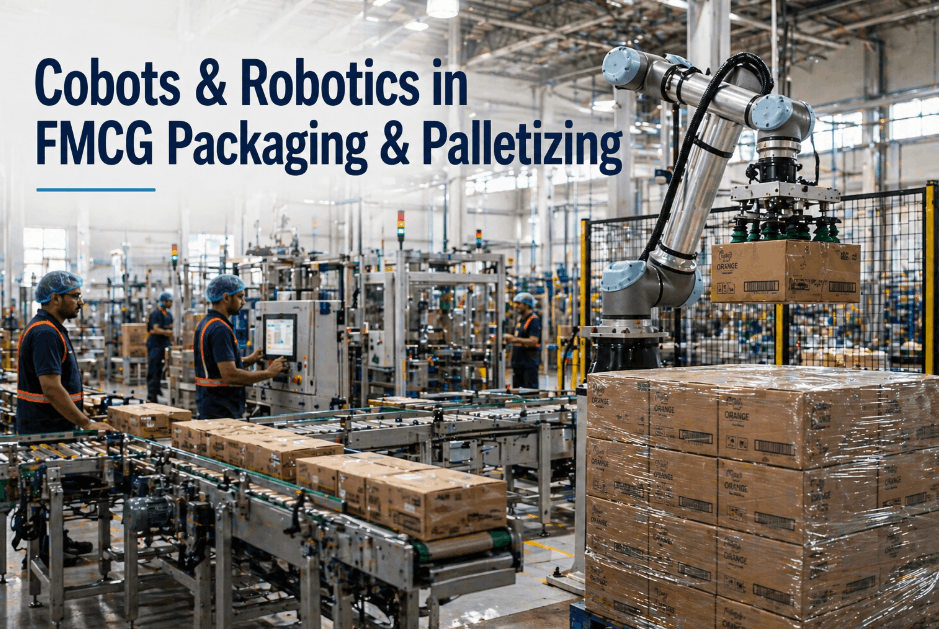
A snack foods manufacturer in Ohio spent 14 months building the business case for a robotic palletizing cell on their highest-volume line — and the CFO rejected it twice. Not because the numbers were wrong, but because the numbers were incomplete. The engineering team calculated labor substitution savings of $186,000 per year from eliminating two palletizing positions across three shifts, subtracted the $420,000 capital cost, and presented a 27-month payback that the finance team considered marginal. What the proposal omitted was $94,000 per year in eliminated product damage from manual stacking errors, $67,000 in reduced workers compensation claims from repetitive lifting injuries, $41,000 in overtime elimination during peak season staffing gaps, and $23,000 in maintenance cost reduction from replacing three aging manual palletizers with one robotic cell tracked through structured preventive maintenance. When the full ROI model captured all five cost categories — labor, damage, safety, overtime, and maintenance — the payback dropped to 11 months and the project was approved in a single meeting. The difference between a rejected proposal and an approved one was not the robot — it was the ROI model. iFactory AI tracks the maintenance cost data, OEE baselines, and asset lifecycle records that complete your robotics ROI model. Book a Demo to see how iFactory helps FMCG operators build CFO-ready robotics business cases.
Robotics ROI Calculator for FMCG Automation — Build a CFO-Ready Business Case
Most FMCG robotics proposals underestimate ROI by 40–60% because they count only labor savings. The complete model captures five cost categories — labor, damage, safety, throughput, and maintenance — delivering payback periods that survive CFO scrutiny and get projects approved.
Why Most FMCG Robotics ROI Proposals Get Rejected
The majority of robotics investment proposals in FMCG are built on a single savings category: labor substitution. An engineer counts the headcount eliminated, multiplies by loaded labor cost, subtracts the capital expense, and presents a payback period. This approach systematically underestimates ROI by 40–60% because it ignores the secondary and tertiary cost categories where robotics delivers measurable, trackable savings — categories that finance teams will credit if the data exists. Plants that track maintenance costs, downtime events, and damage incidents per asset in iFactory AI have the historical data to build ROI models that capture the full savings picture and get projects approved.
Labor-only models miss 45–55% of total savings
Labor substitution is the obvious savings category — but damage reduction, safety improvement, throughput gains, and maintenance cost reduction collectively equal or exceed labor savings at most FMCG operations. Omitting these categories makes payback periods look 2–3x longer than reality.
Hidden costs ignored — damage, safety, overtime, maintenance
Manual case stacking damages 0.4–0.9% of cases. Repetitive-lifting injuries drive 35–55% of FMCG workers comp claims. Absentee coverage runs $30K–$55K per line annually. Aging manual equipment costs 40–77% more to maintain than robotic cells. Each of these is a real cost that belongs in the ROI model.
No baseline data for validation
CFOs need documented evidence — not estimates — for each savings category. Without historical data on maintenance costs per asset, damage write-offs per line, and OEE baselines, the ROI model is an unsupported projection that finance teams will reject or heavily discount.
One-shift payback math that doesn't scale
ROI models built on single-shift operations produce payback periods 2–3x longer than reality. Every additional shift accelerates payback proportionally because the robot's capacity is already deployed. Three-shift operations typically achieve payback in half the time of single-shift projections.
The Five Savings Categories Every Robotics Business Case Must Include
A defensible robotics ROI model for FMCG operations captures savings across five distinct categories. Each category has specific data sources, calculation methods, and confidence levels that finance teams can verify independently. Presenting all five with documented assumptions gives the CFO a model they can stress-test rather than a single number they must accept on faith.
Labor Substitution
Direct headcount reduction or reallocation. Calculate loaded labor cost (wages + benefits + overtime + training + turnover) x positions eliminated x shifts covered. Typically 45–55% of total savings.
Damage Reduction
Manual handling causes 0.4–0.9% damage rates on heavy SKUs. Robotic cells reduce handling damage 55–75%. Pull 12 months of damage write-offs from ERP for documented baselines.
Safety & Workers Comp
Ergonomic injury claims from repetitive lifting average $48,000 each. OSHA recordable rates drop 60–80% after robotic deployment. Include EMR impact on insurance premiums.
Throughput Recovery
Robots run through shift changes, breaks, absenteeism, and holidays without throughput degradation. Night shift output gap alone represents $180K–$350K in annual lost production per line.
Maintenance Cost Reduction
Aging manual equipment costs 40–77% more to maintain than robotic cells under structured PM. Track per-asset maintenance costs in iFactory to build documented OPEX projections.
The ROI Formula That Gets CFO Approval
CFOs evaluate robotics investments against alternative uses of capital. A payback period under 18 months typically receives approval without escalation. Between 18–30 months requires additional justification. Beyond 30 months is rejected at most FMCG companies. Here is how to calculate it correctly using all five cost categories.
Simple Payback Formula
Payback (months) = Total CAPEX ÷ Monthly Net Savings
Monthly Net Savings = (Labor + Damage + Safety + Throughput + Maintenance) ÷ 12 − Monthly OPEX of Robotic Cell
Example: $420K CAPEX ÷ [($186K + $94K + $67K + $41K + $23K) ÷ 12 − $2.2K/mo] = $420K ÷ $32.0K/mo = 13.1 months payback
| Application | Typical CAPEX | Annual Savings | Primary Savings Source | Payback |
|---|---|---|---|---|
| End-of-Line Palletizing | $350K–$600K | $280K–$450K | Labor (50%) + Safety (25%) + Damage (15%) | 10–18 months |
| Robotic Pick-and-Place | $200K–$400K | $150K–$320K | Throughput (40%) + Labor (35%) + Quality (15%) | 12–20 months |
| Case Packing / Erecting | $250K–$500K | $180K–$350K | Labor (45%) + Throughput (30%) + Damage (15%) | 14–22 months |
| Autonomous Mobile Robots | $150K–$300K per unit | $120K–$220K per unit | Labor (40%) + Damage (30%) + Maintenance (20%) | 12–18 months |
| AI Vision Inspection | $80K–$200K | $100K–$250K | Quality (45%) + Labor (30%) + Throughput (15%) | 8–16 months |
Getting the Labor Substitution Calculation Right
Labor substitution is the core of every robotics ROI model — but the calculation is frequently wrong because it uses base wage instead of fully loaded cost, ignores turnover expense, and assumes 100% headcount elimination when the reality is often reallocation. Here is the correct formula.
Common Mistakes
- Using base wage ($22/hr) instead of fully loaded cost ($30–$34/hr)
- Ignoring turnover expense — $4K–$8K per event at 35–45% annual turnover
- Assuming 1.0 FTE per position instead of actual coverage factor (1.3–1.4 FTEs)
- Excluding seasonal temp labor premiums and agency fees
- Counting only direct wages, omitting overtime and shift differentials
Correct Calculation
- Fully loaded cost = base wage × 1.35–1.55 (benefits, FICA, insurance, training)
- Annual cost per position = fully loaded rate × 2,080 hours × coverage factor
- Include turnover avoidance: eliminated positions × turnover rate × replacement cost
- Account for all shifts — a 3-shift operation eliminates 3.0–4.2 FTEs
- Add overtime premium reduction from absenteeism and peak season coverage
Three Deployment Paths for FMCG Robotics Automation
Same starting point, three valid destinations. The right path depends on automation maturity, capital availability, and operational readiness. Operators that pick the wrong path spend months in pilot purgatory. Operators that pick the right path deploy in weeks.
Single-Cell Pilot
Deploy one robotic cell on the highest-pain line. Build baseline data across all five cost categories. Validate ROI model with actual production data before expanding. 4–8 weeks to production.
Multi-Cell Rollout
Deploy 3–5 robotic cells across highest-ROI lines simultaneously. CMMS integration from day one for lifecycle tracking. Centralized OEE and maintenance analytics. 8–14 weeks to full production.
Facility-Wide Transformation
Full end-of-line automation across all production lines. Integrated with MES, CMMS, and ERP for complete lifecycle ROI tracking. Predictive maintenance on all robotic assets. 12–20 weeks phased deployment.
Build Your Robotics ROI Business Case with Real Data
iFactory AI tracks the per-asset maintenance costs, OEE baselines, and lifecycle data that populate every category of the five-category ROI model. See how your specific FMCG line economics map to robotic automation payback.
Robotic Cell TCO — What the Full 10-Year Picture Looks Like
CAPEX gets the attention, but OPEX determines long-term ROI. A robotic cell with poor maintenance practices can cost more to operate per year than the manual process it replaced — erasing the savings that justified the investment. Here is the realistic TCO model for a typical FMCG robotic palletizing cell.
| Cost Category | Year 1 | Years 2–5 (Annual) | Year 5–7 Refurbishment | 10-Year Total |
|---|---|---|---|---|
| Capital (CAPEX) | $420,000 | $0 | $0 | $420,000 |
| Maintenance & Parts | $8,000 | $12,000–$18,000 | $0 | $128,000–$170,000 |
| Energy & Consumables | $6,000 | $6,000–$8,000 | $0 | $60,000–$78,000 |
| Major Refurbishment | $0 | $0 | $50,000–$80,000 | $50,000–$80,000 |
| Software & Licensing | $12,000 | $12,000 | $12,000 | $120,000 |
| Total Cost | $446,000 | $30K–$38K/yr | $62K–$92K | $778K–$868K |
Against this TCO, a well-documented five-category savings model generates $2.5M–$4.5M in cumulative savings over the same 10-year period — a 3–5x return on total investment. The key variable is maintenance discipline: cells managed through structured CMMS programs achieve the lower end of the OPEX range.
What Operations Leaders Say About Building the Robotics Business Case
The single biggest mistake I see in robotics proposals across FMCG is not the technology selection or the integration plan — it is the ROI model. Engineering teams spend months evaluating robot brands, end-effector options, and cycle times, then submit a business case that counts only labor savings and wonders why the CFO pushes back. The CFO knows that labor is only part of the picture. They know there are damage costs, injury costs, absentee coverage costs, and maintenance premium costs in the current operation. What they need is documented evidence of those costs — not estimates — so they can validate the model against actual P&L data. The plants that get robotics projects approved are the ones that track per-line maintenance costs, damage write-offs by SKU, and OEE by shift in their CMMS before they ever write the capital request. When you show up with 12 months of documented data across all five cost categories, the payback period sells itself. When you show up with a labor-only estimate, you get sent back to build a real model.
— FMCG Operations Executive, 2026 industry insightCapital Purchase vs Robotics-as-a-Service — Which Fits Your Model?
The decision between buying robots outright (CAPEX) and subscribing through Robotics-as-a-Service (RaaS) depends on capital availability, integration risk, and deployment horizon. Each model has distinct advantages for different FMCG operating contexts.
| Factor | CAPEX (Outright Purchase) | RaaS (Subscription) |
|---|---|---|
| Upfront cost | $50K–$600K per cell | $0 upfront; $1.5K–$8K/mo per unit |
| Approval timeline | Requires capital committee; 1–3 months | OPEX budget; days to weeks |
| Lifetime cost (5+ years) | Lower — best for proven deployments | ~35% premium past 18 months |
| Best fit | Established use cases, stable production | Pilots, variable volume, capital-constrained |
| Section 179 tax benefit (2026) | Eligible — full deduction in year 1 | Not eligible — operating expense treatment |
The Five-Category Model Transforms Rejected Proposals into Approved Investments
The difference between a rejected robotics proposal and an approved one is rarely the technology — it is the completeness of the business case. FMCG operators who build their ROI model around all five cost categories — labor substitution, damage reduction, safety improvement, throughput recovery, and maintenance cost reduction — consistently achieve payback periods under 18 months and get projects approved without escalation. The data to populate these categories already exists in your ERP, CMMS, and safety records. The missing piece is a structured approach to extracting, validating, and presenting that data in a format that CFOs can defend to the board. Book a Demo to see how iFactory AI tracks the per-asset lifecycle data that completes your robotics ROI model and gets your next automation project approved.
Run Your Robotics ROI Model with Your Actual Production Data
iFactory AI's FMCG automation practice runs a focused workshop against your specific line economics — labor costs, damage rates, injury claims, throughput data, and maintenance records. You leave with a complete five-category ROI model, a defended payback projection, and a deployment path recommendation grounded in your actual operational data.