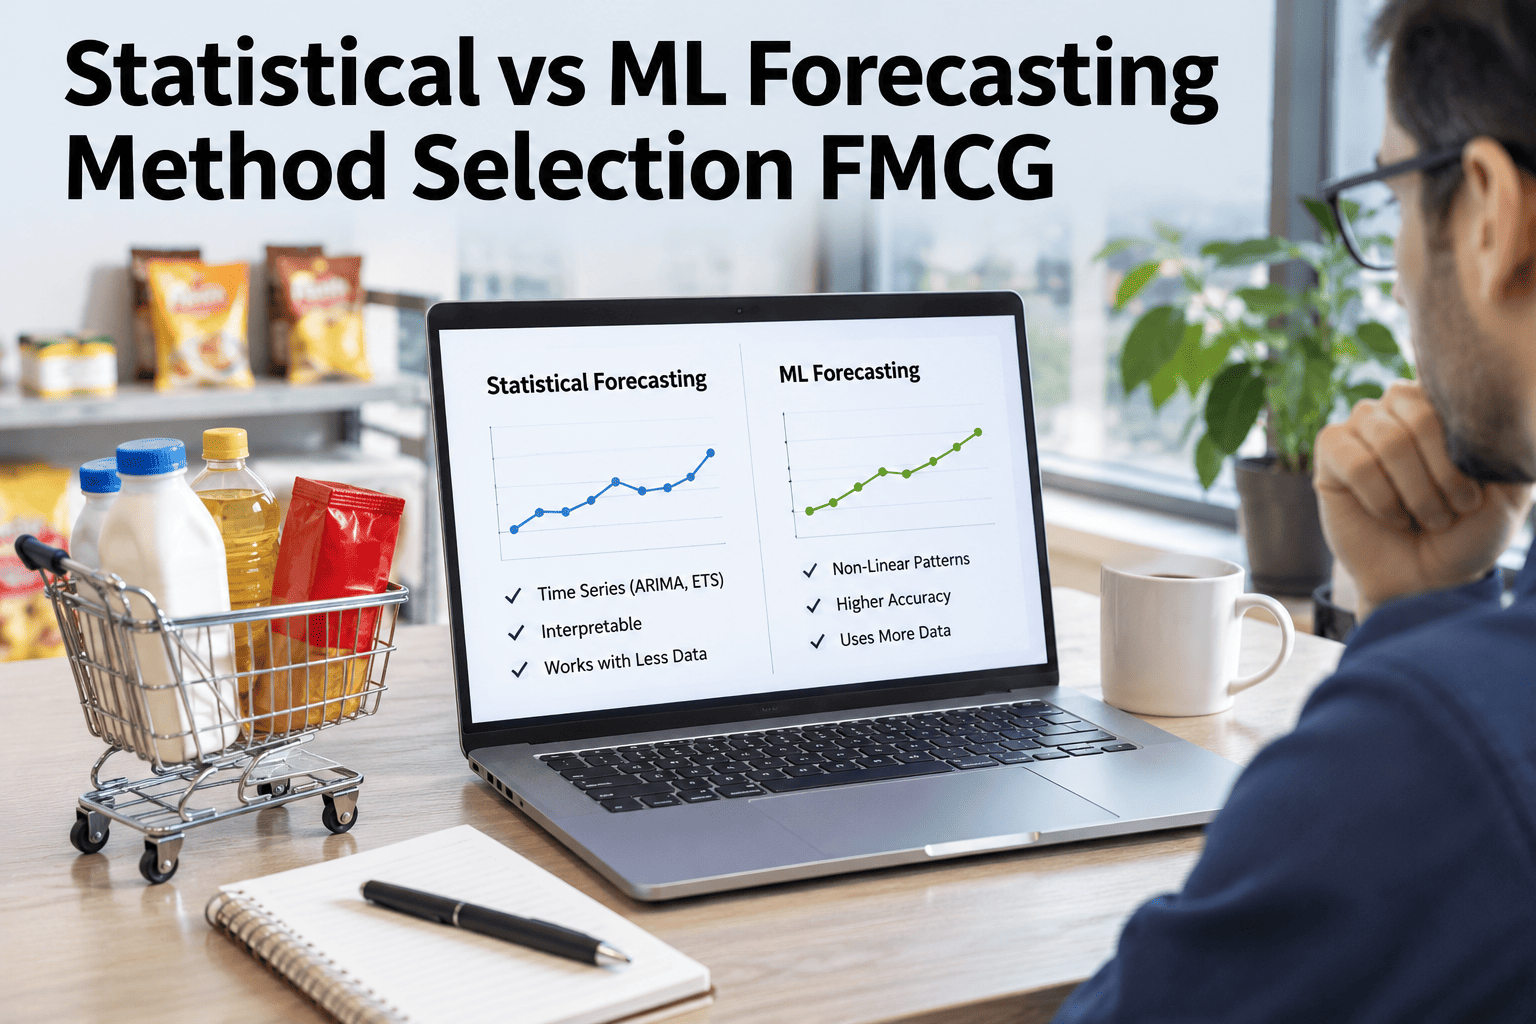
Classical statistical forecasting still wins on stable, low-volatility SKUs, and switching every item to machine learning just to say the stack is "AI-powered" wastes compute on demand patterns a simple moving average already predicts well. Independent comparisons of FMCG forecasting methods consistently show machine learning pulling ahead specifically where demand is non-linear or driven by promotions, weather and multiple signals at once — with accuracy gains in the range of 20 to 50 percentage points over traditional statistical baselines on those SKUs (industry forecasting analysis, 2026). The method selection question is not "which is better" — it is which SKUs belong in which bucket. You can run this split against your own SKU portfolio with our team.
FMCG Demand Planning, 2026
Not Every SKU Needs a Neural Network
iFactory Adaptive Forecasting runs statistical and ML methods side by side, automatically routing each SKU to whichever method performs best for its demand pattern, and re-checking that assignment as patterns shift.
Classical Wins
Stable, low-volatility, long-history SKUs
ML Wins
Non-linear, promo-driven, multi-signal SKUs
Hybrid
New launches, seasonal transitions, category shifts
What it is
What Does Method Selection Actually Mean for FMCG Forecasting?
Method selection is the practice of matching each SKU to the forecasting approach best suited to its demand pattern, rather than running one method — statistical or ML — across the entire portfolio by default.
A classical ARIMA or exponential smoothing model reads history cleanly and runs cheaply, which makes it a strong fit for a SKU with stable, repeatable demand. The same model falls apart on a SKU whose demand depends on a promotion calendar, weather, or a competitor's stockout — exactly where ML earns its complexity.
Where classical still wins
Four Signs a SKU Belongs With a Statistical Model
Long, stable history
Years of consistent demand with no major pattern breaks.
Low promotional sensitivity
Demand barely moves whether the SKU is promoted or not.
Simple seasonality
One clean seasonal cycle a classical model captures well.
Low value, high volume
The cost of an error is small enough that model complexity is not worth it.
Where ML earns its complexity
Four Signs a SKU Belongs With a Machine Learning Model
Promotion-driven spikes
Demand swings sharply around promotional calendars a linear model cannot capture.
Multiple demand signals
Weather, social sentiment or competitor activity all move the number.
Frequent pattern shifts
The demand curve changes shape often enough that a static model goes stale fast.
High value, high risk
The cost of a forecast miss justifies the extra modeling effort.
See Where Your SKUs Actually Fall
Share a sample of your SKU portfolio and demand history and see which ones are over-served by ML and which are under-served by a simple model.
Book a Method Audit
Ask About Model Routing
Comparison
Statistical vs ML vs Hybrid, Side by Side
| Dimension | Statistical | Machine Learning | Hybrid |
|---|
| Best fit | Stable, low-volatility SKUs | Non-linear, multi-signal SKUs | New launches, transitions |
| Data needed | Modest history, works with little data | Rich history plus external signals | Blends both as history builds |
| Interpretability | High — easy to explain to planners | Lower — needs explanation tooling | Moderate, improves over time |
| Compute cost | Low | Higher | Moderate |
How it works
Four Steps to a Method-Routed Forecasting Stack
1
Segment SKUs by volatility, promotional sensitivity and value, not by category or brand alone.
2
Run both statistical and ML methods on a holdout period and compare actual accuracy per SKU segment.
3
Route each SKU to whichever method wins for its segment, not a single stack-wide default.
4
Re-check routing on a schedule, since a SKU's volatility profile can shift as it matures or a category changes.
Expert review
What a Demand Planning Director Would Check First
Holds up
Matching model complexity to demand complexity is a long-standing forecasting principle; FMCG's SKU variety just makes the mismatch more visible than in simpler categories.
Watch for
A "we use AI for everything" stack that quietly burns compute and planner trust on SKUs a simple model would have forecast just as well.
Do next
Start the method audit on your highest-value SKU tier first, since that is where a routing mismatch costs the most either way.
FAQ
What FMCG Demand Teams Ask About Method Selection
How much more accurate is ML than statistical forecasting in FMCG?
On non-linear, promotion-driven or multi-signal SKUs, ML methods typically show accuracy gains of 20 to 50 percentage points over traditional statistical baselines. On stable, low-volatility SKUs, the gap narrows substantially and a classical model often performs just as well (industry forecasting analysis, 2026).
Check your own SKU-level gap with our team.
Should every SKU eventually move to machine learning?
No — stable, low-value SKUs rarely justify the added complexity and compute cost of ML, since a classical model captures their pattern just as accurately for less effort. Method selection is an ongoing match, not a one-way migration.
Ask how routing decisions are made.
How is a hybrid approach different from choosing one method?
A hybrid approach blends statistical and ML outputs, which is particularly useful for new product launches or seasonal transitions where there is not yet enough history for ML alone to be reliable, but a pure statistical model would miss emerging signal.
How often should method routing be reviewed?
Quarterly is a reasonable default, with an additional check whenever a SKU's volatility profile changes meaningfully — a new promotion cadence, a competitor shift, or a category-wide demand pattern change.
Discuss a review cadence for your portfolio.
Can planners trust an ML forecast as easily as a statistical one?
Trust usually takes longer to build with ML outputs because the reasoning is less transparent than a statistical model's. Explanation tooling that shows which signals drove a given forecast helps close that gap faster than accuracy numbers alone.
See how explanation tooling works with our team.