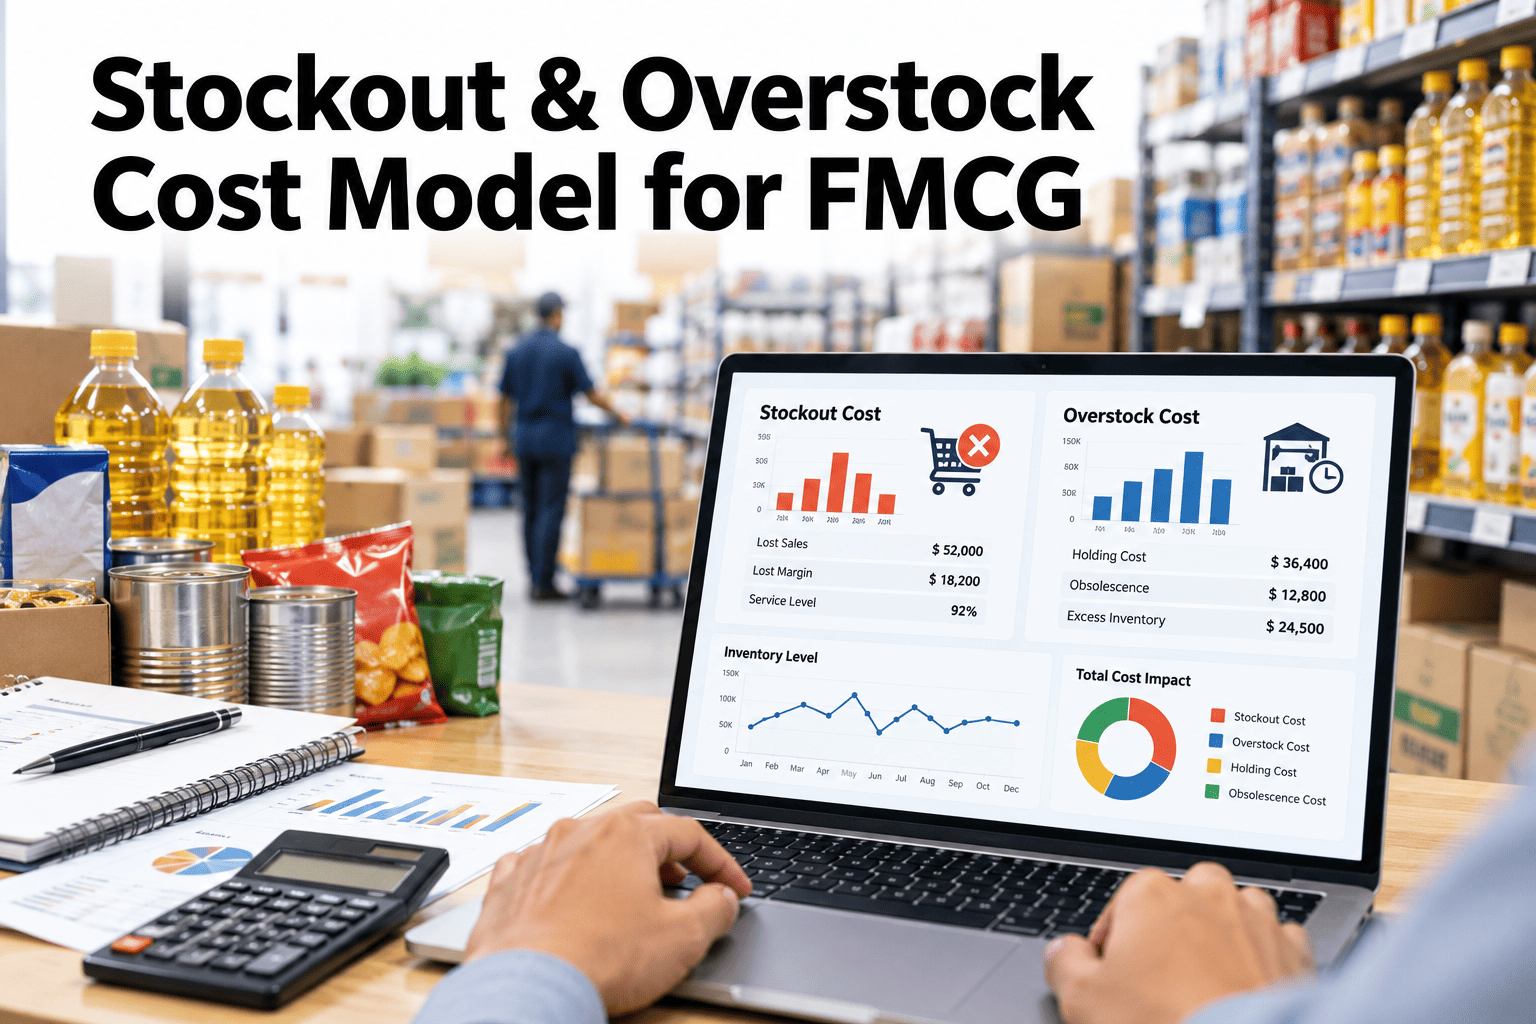
A stockout and an overstock on two different SKUs can look like opposite problems and still share the same root cause: a forecast that missed. Treating them as separate line items — lost sales here, a write-off there — hides the real size of the problem, because neither number alone captures case-fill penalties, brand switching, markdown erosion and holding cost together. Industry analysis puts the global cost of retail and FMCG inventory distortion at roughly $1.77 trillion a year, with 72% of consumers switching brands after a single stockout event (industry inventory distortion analysis, 2026). You can build a cost-of-imbalance model for your own SKU portfolio with our team.
FMCG Inventory Economics, 2026
One Forecast Miss, Two Different-Looking Costs
iFactory Adaptive Forecasting combines case-fill loss, brand switching, spoilage, markdown and holding cost into one defensible cost-of-imbalance number per SKU, so stockout and overstock risk are weighed on the same scale.
$1.77T
Global annual cost of retail & FMCG inventory distortion (industry analysis, 2026)
72%
Consumers who switch brands after one stockout (industry analysis, 2026)
What it is
What Is a Stockout and Overstock Cost Model?
A cost-of-imbalance model combines every cost component tied to a forecast miss — on either side — into one comparable number per SKU, so a planner can weigh the risk of running too lean against the risk of running too heavy using the same unit.
Without this, a stockout shows up as a visible lost-sales line and an overstock shows up as a quieter markdown or write-off months later, and the two never get compared directly — even though they are both the downstream cost of the same forecast error.
The components
What Belongs in a Defensible Cost-of-Imbalance Number
Case-fill loss
Lost or partial shipments to retail accounts when a stockout hits order fulfillment.
Brand switch
Revenue that does not come back even after the SKU restocks, as the consumer bought elsewhere.
Spoilage & markdown
Overstock on perishable or dated product converts to write-offs or discounted clearance.
Holding cost
Capital, warehousing and handling cost tied up in excess inventory that is not moving.
The formula
How the Cost of Imbalance Comes Together
Calculated per SKU and tracked over time, this number lets a demand team rank which forecast misses actually cost the most, rather than reacting to whichever one was loudest that week — a stockout that triggers a visible customer complaint, or a quiet overstock nobody flagged until the write-off.
Comparison
Tracking Stockouts and Overstock Separately vs Combined
| Dimension | Tracked Separately | Combined Cost of Imbalance |
|---|
| Visibility | Stockouts visible fast, overstock lags | Both visible on the same timeline |
| Comparison | Cannot weigh one against the other | Ranked on one common cost basis |
| Prioritization | Driven by whichever is loudest | Driven by actual dollar impact |
| Forecast tuning | Optimizes against one risk at a time | Balances both risks together |
Using the number
What Changes Once You Have One Comparable Number
With stockout and overstock cost on the same scale, a demand team can set safety stock and forecast bias deliberately for each SKU, rather than defaulting to the same buffer logic across the whole portfolio.
A SKU where stockout cost dominates justifies a slightly generous safety stock. A SKU where overstock and spoilage dominate justifies the opposite — a leaner buffer, even at the cost of occasional stockouts. The cost model is what makes that decision defensible rather than a guess.
Expert review
What a Supply Chain Finance Lead Would Check First
Holds up
Combining stockout and overstock cost into one comparable figure is standard inventory economics, not a novel framework — the value is in building it per SKU rather than as a portfolio average.
Watch for
A model that captures case-fill loss but skips brand-switch revenue — leaving out that component understates true stockout cost significantly.
Do next
Build the model first for your highest-volume SKU tier, since that is where the dollar impact of getting the balance wrong is largest.
FAQ
What Demand Teams Ask About Cost-of-Imbalance Modeling
Why not just track stockout cost and overstock cost separately?
Tracked separately, the two costs never get compared on the same basis, so a demand team cannot tell whether tightening safety stock to reduce overstock is actually making the bigger stockout problem worse. A combined view answers that question directly.
See a combined model on your own SKUs.
What is the hardest cost component to estimate accurately?
Brand-switch revenue loss is typically the hardest, since it depends on consumer behavior after a stockout rather than a directly observable transaction. Industry research putting the figure near 72% of consumers switching after one stockout is a reasonable starting assumption to calibrate against your own category.
Ask how to estimate this component for your brands.
How often should the cost-of-imbalance model be recalculated?
Quarterly is a reasonable cadence for most FMCG portfolios, with a refresh after any major pricing, promotion or holding-cost change that would shift the underlying components.
Discuss a recalculation schedule with our team.
Does this model apply the same way to perishable and non-perishable SKUs?
No — spoilage weighs much more heavily for perishable or dated product, while holding cost and markdown dominate for shelf-stable SKUs with long dating. The model should weight components differently by product type rather than applying one formula uniformly.
Can this cost model feed directly into safety stock settings?
Yes — once a SKU's cost of imbalance shows which side of the error costs more, that insight should directly inform whether its safety stock and forecast bias lean toward availability or lean, rather than using one default buffer rule across the portfolio.
See how this connects to safety stock with our team.