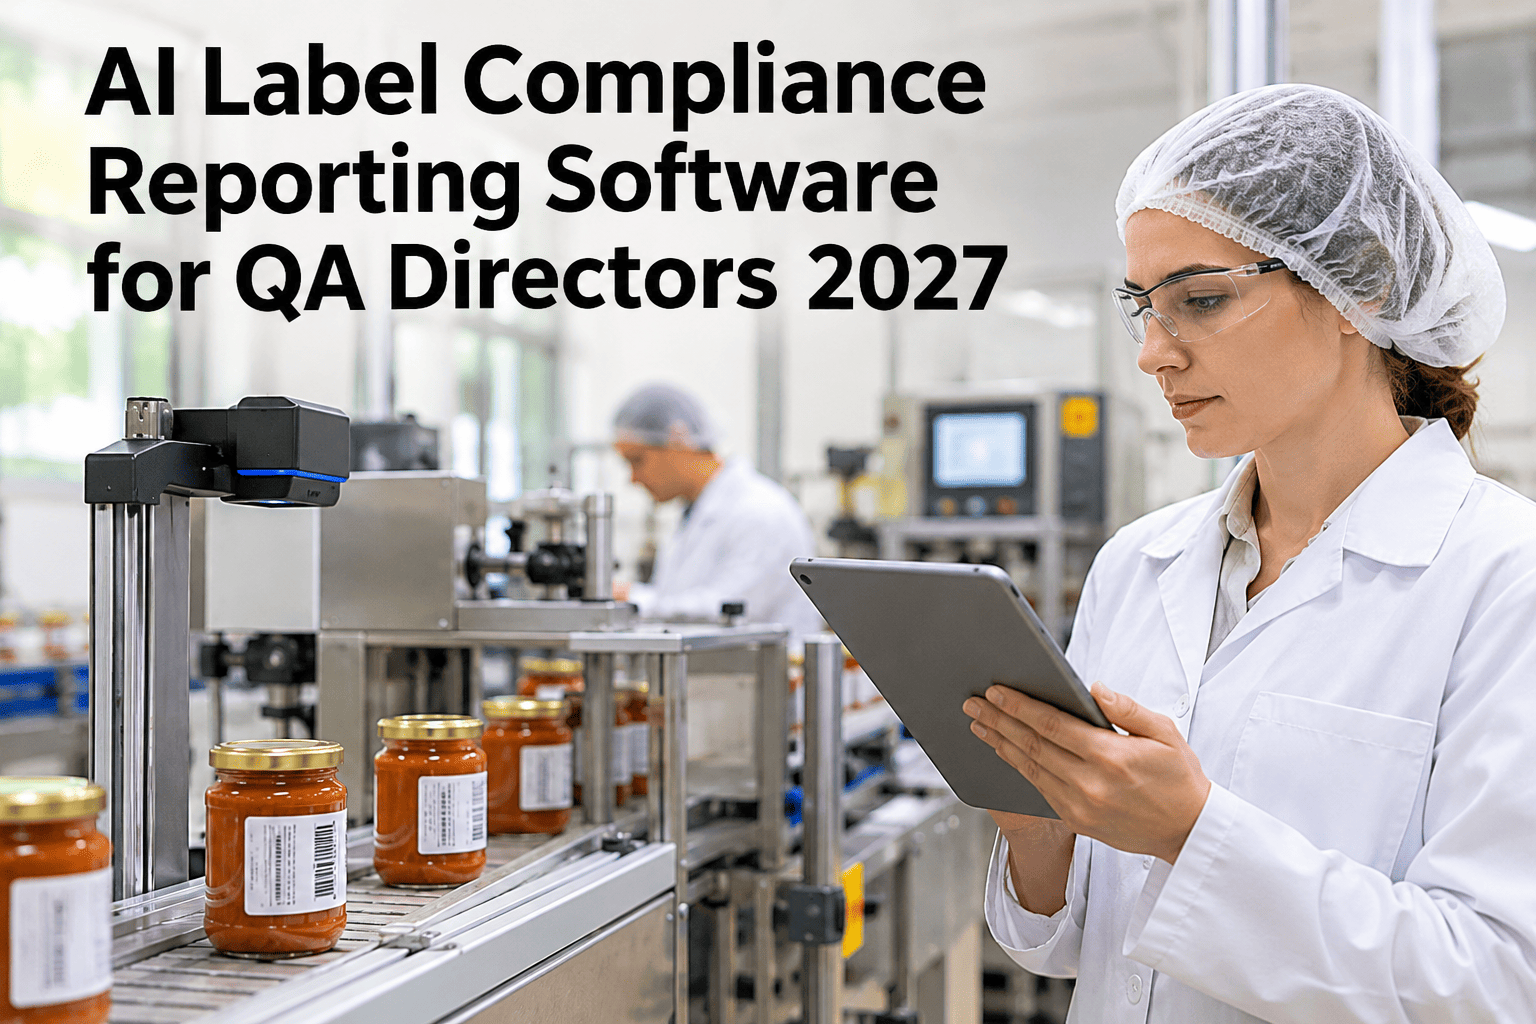
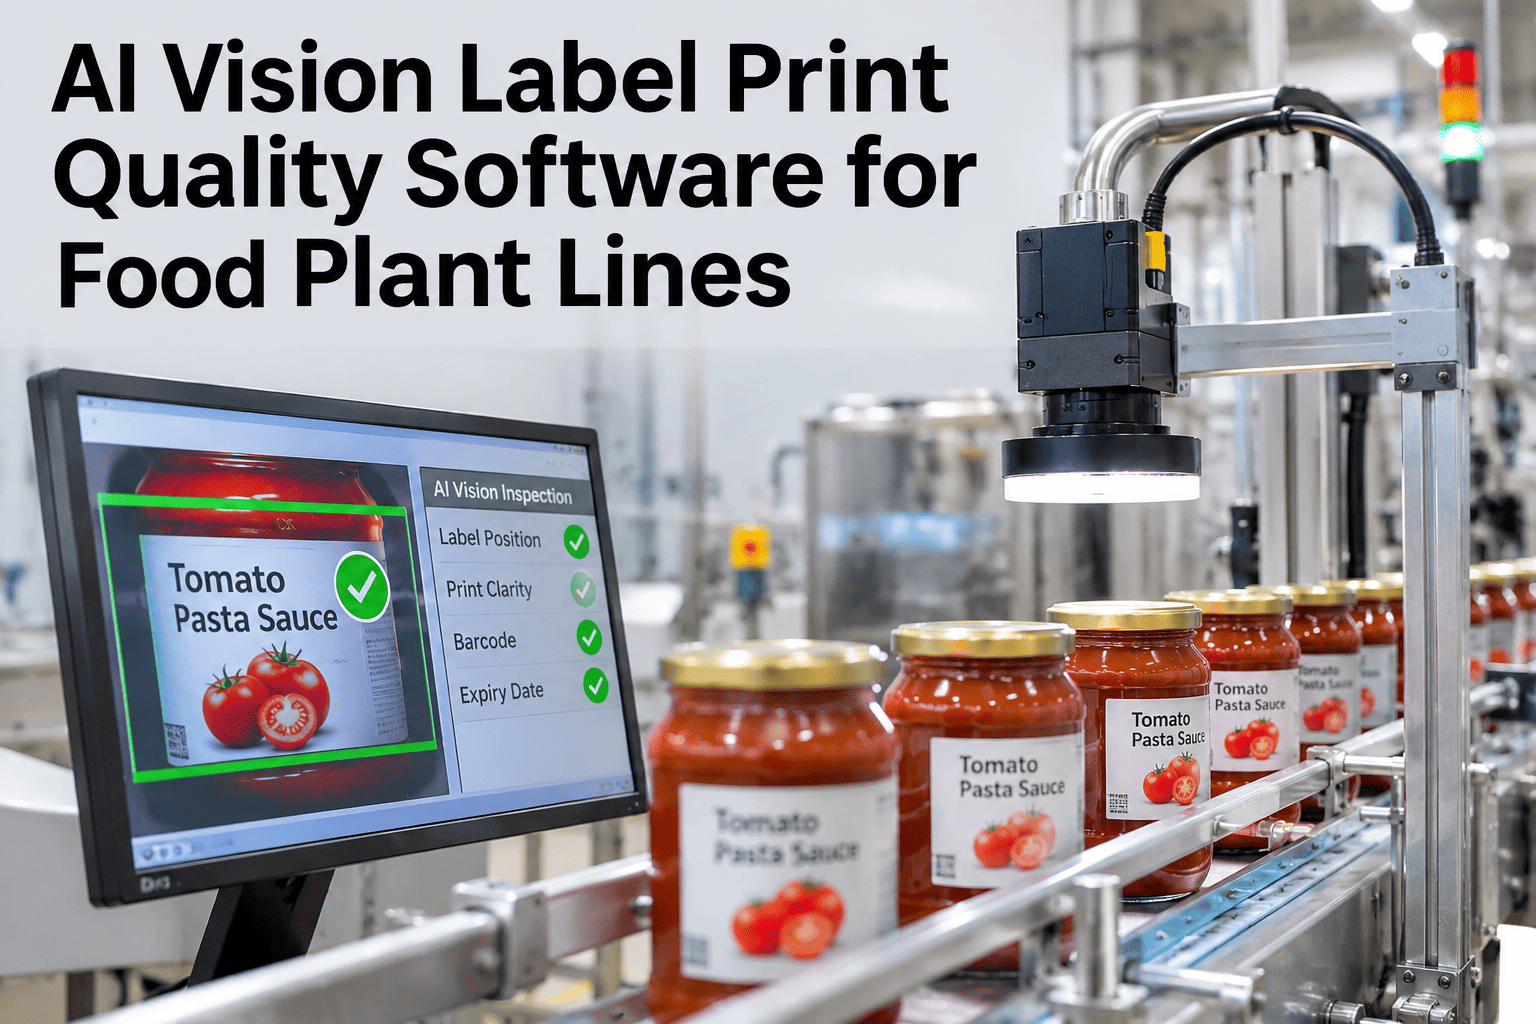
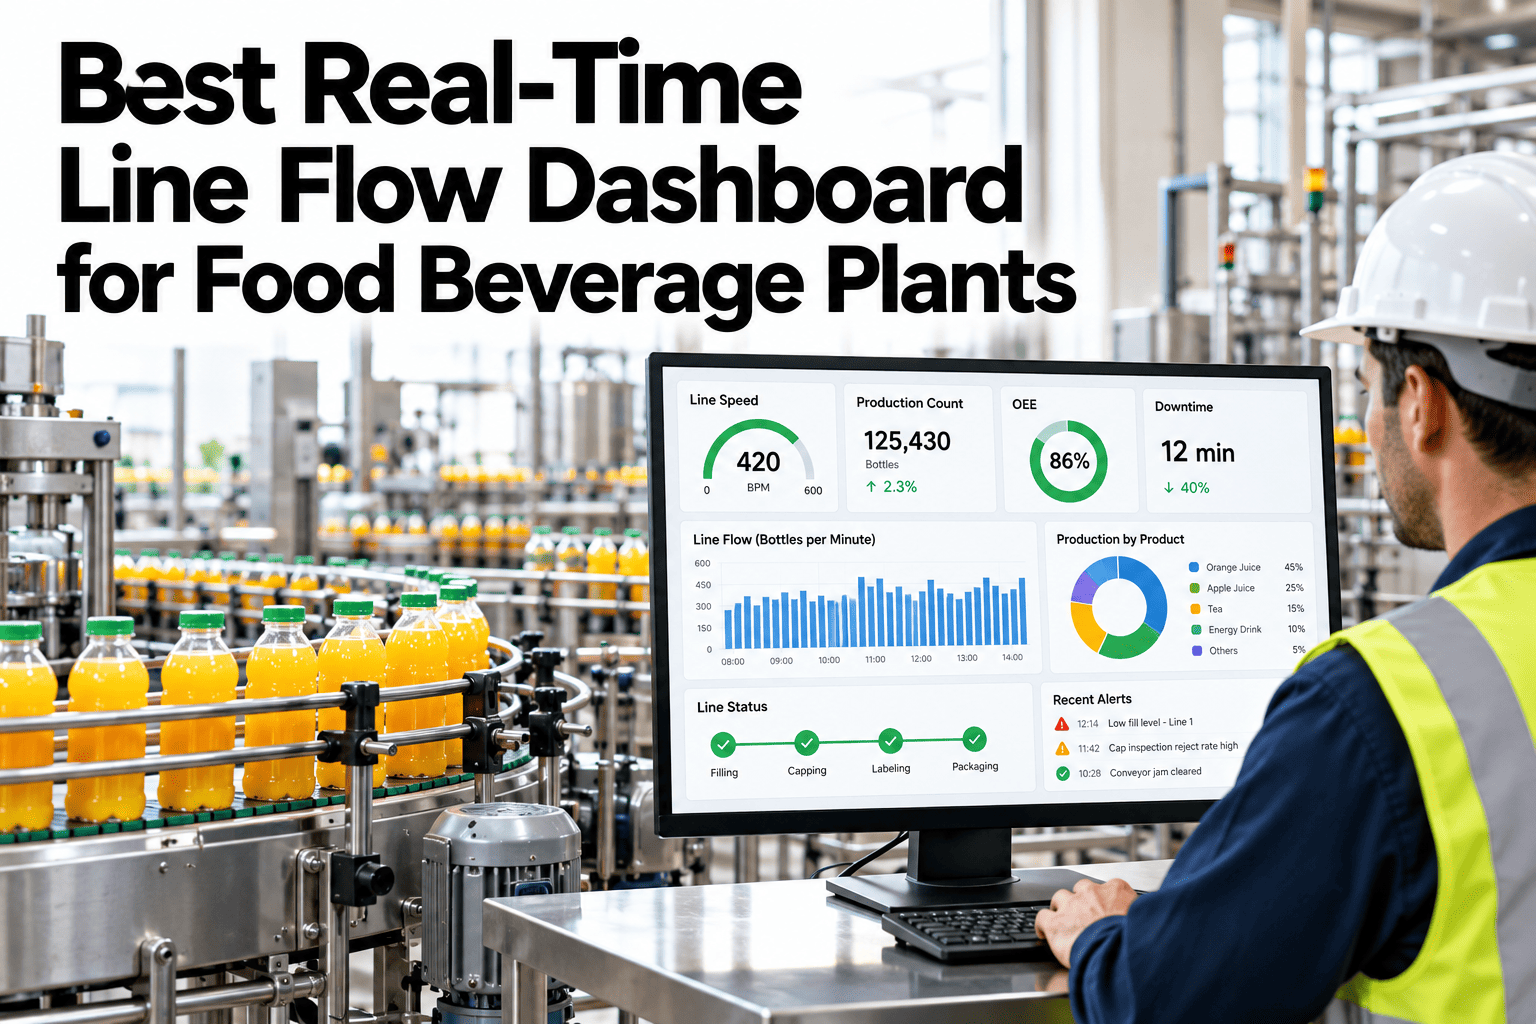
A QA director cannot manage what the label line is not reporting on. Most plants can tell you total downtime but not first-pass label pass rate by SKU, and not which defect code is actually driving the rejects on a given line. Label errors drove 45.5 percent of US food recalls in 2024 at an estimated $1.92 billion cost to the industry (Loftware analysis of FDA enforcement data, 2026). iFactory, an on-premise AI platform with AI Vision Camera and automated analytics reporting built in, tracks first-pass pass rate and defect codes by SKU and line automatically. QA directors who want this reporting on their own lines can request a demo with our team.
AI Label Compliance Reporting · Food QA, 2026
First-Pass Label Pass Rate, by SKU and Line, Without Anyone Compiling a Spreadsheet
iFactory AI tracks every label check result automatically, surfacing pass rate and top defect codes the moment a trend starts, not at the end of the month.
0%First-pass pass rate: 96.4%100%
Why this matters now
Labeling Is the Most Common Recall Cause QA Directors Actually Control
Unlike contamination risk, which often originates upstream in the supply chain, labeling accuracy is almost entirely within a QA director's own process control — the line that prints and applies the label, checked against the specification that was approved. Allergen mislabeling alone accounted for 45.8 percent of 2025 food and beverage recall events (Esko analysis of FDA recall data, 2026).
The KPI gap
What Most Label Reporting Is Missing Today
| Common reporting today | What's missing | What AI reporting adds |
|---|
| Total reject count per shift | No breakdown by SKU or defect type | Pass rate and defect code by SKU, by line, by shift |
| Monthly quality summary | A trend is already weeks old by the time it is reviewed | Live dashboard updated with every label check |
| Operator-logged defects | Inconsistent categorization between operators | Consistent, vision-derived defect codes every time |
Top defect codes
The Defect Codes That Actually Drive Most Rejects
Missing/incorrect allergen statement
34%
Nutrition panel field mismatch
27%
Print quality / unreadable text
21%
Wrong label applied to SKU
18%
Illustrative distribution of label defect categories, representative of patterns seen across food packaging lines rather than a universal fixed ratio.
See What Your Current Reject Data Would Show by SKU
Share a sample of your current label reject logs and iFactory AI will show what a SKU-level and defect-code breakdown would reveal.
From report to action
Four Steps From a Flagged Trend to a Closed CAPA
1
Pass rate drifts
A specific SKU's first-pass rate drops below its established baseline.
2
Defect code isolates the cause
The dominant defect code for that SKU narrows the investigation immediately.
3
CAPA opened automatically
A corrective action record is generated with the supporting data attached.
4
Pass rate confirms the fix
The same dashboard that flagged the issue confirms whether the fix actually worked.
Reporting to leadership
Turning Label Data Into a Report a CFO or Plant GM Will Actually Read
A QA director's monthly update is more persuasive with a SKU-level pass rate trend and a ranked defect list than with a single plant-wide reject percentage — it shows exactly where the risk sits and what is being done about it, which matters both internally and in front of an auditor.
Expert review
What a QA Director Checks First
Label compliance reporting earns its place on a QA director's desk when it changes what gets investigated first, not just what gets counted at month end.
Verdict
Strong when defect codes are consistent enough across shifts and lines to actually trend over time.
Watch for
Operator-logged defect categories that differ in meaning from one shift to the next, which quietly breaks every trend built on top of them.
Do next
Pull your last 90 days of label rejects and check whether they are even categorized consistently enough to trend by SKU.
Frequently asked questions
What QA Directors Ask About Label Compliance Reporting
How much does labeling actually cost the industry in recalls?
Can this replace our manual label audit process entirely?
Do defect codes need to be customized for our product lines?
Yes — defect code categories are typically configured to match your specific label content and SKU structure so the reporting reflects your actual risk areas rather than a generic template.
Discuss defect code setup for your SKUs.
How is this different from a standard vision inspection reject counter?
A reject counter tells you how many units failed; this reporting tells you which SKU, which defect type, and whether the trend is getting better or worse — the difference between a count and a diagnosis.
Ask support about the reporting detail level.
Can this data be used directly in an FDA or auditor inquiry?
The underlying data — pass rate by SKU, defect codes, and corrective actions taken — is retained and retrievable, which is exactly the kind of record regulators increasingly expect during a recall investigation.
Talk through audit-readiness for your plant.
Know which SKU and which defect, not just how many
Give Your QA Team Label Reporting They Can Act On
Book a demo to see first-pass pass rate and top defect codes by SKU and line for your own plant.
{"@context":"https://schema.org","@type":"FAQPage","mainEntity":[
{"@type":"Question","name":"How much does labeling actually cost the industry in recalls?","acceptedAnswer":{"@type":"Answer","text":"Label errors were the leading cause of US food recalls in 2024, accounting for 45.5 percent of events and an estimated $1.92 billion in industry cost."}},
{"@type":"Question","name":"Can this replace our manual label audit process entirely?","acceptedAnswer":{"@type":"Answer","text":"Automated reporting gives continuous, line-level visibility, though most plants keep a manual audit as a secondary check during transition."}},
{"@type":"Question","name":"Do defect codes need to be customized for our product lines?","acceptedAnswer":{"@type":"Answer","text":"Yes, defect code categories are typically configured to match your specific label content and SKU structure."}},
{"@type":"Question","name":"How is this different from a standard vision inspection reject counter?","acceptedAnswer":{"@type":"Answer","text":"A reject counter tells you how many units failed; this reporting tells you which SKU, which defect type, and the trend direction."}},
{"@type":"Question","name":"Can this data be used directly in an FDA or auditor inquiry?","acceptedAnswer":{"@type":"Answer","text":"The underlying data, pass rate by SKU, defect codes, and corrective actions, is retained and retrievable for audit purposes."}}
]}