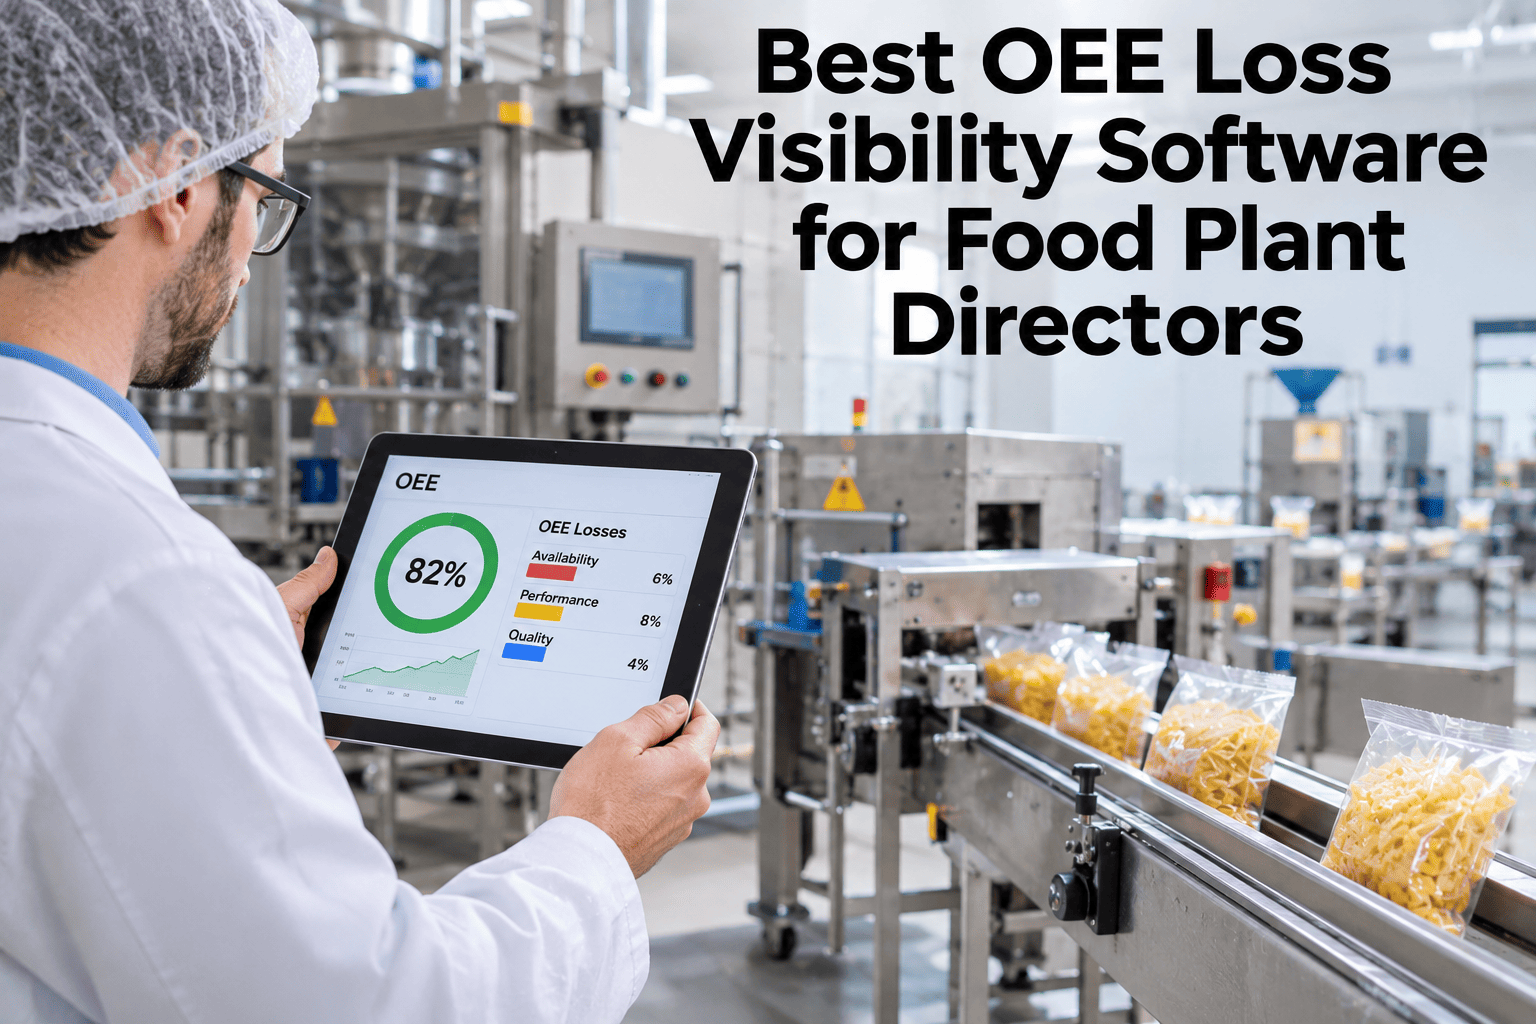
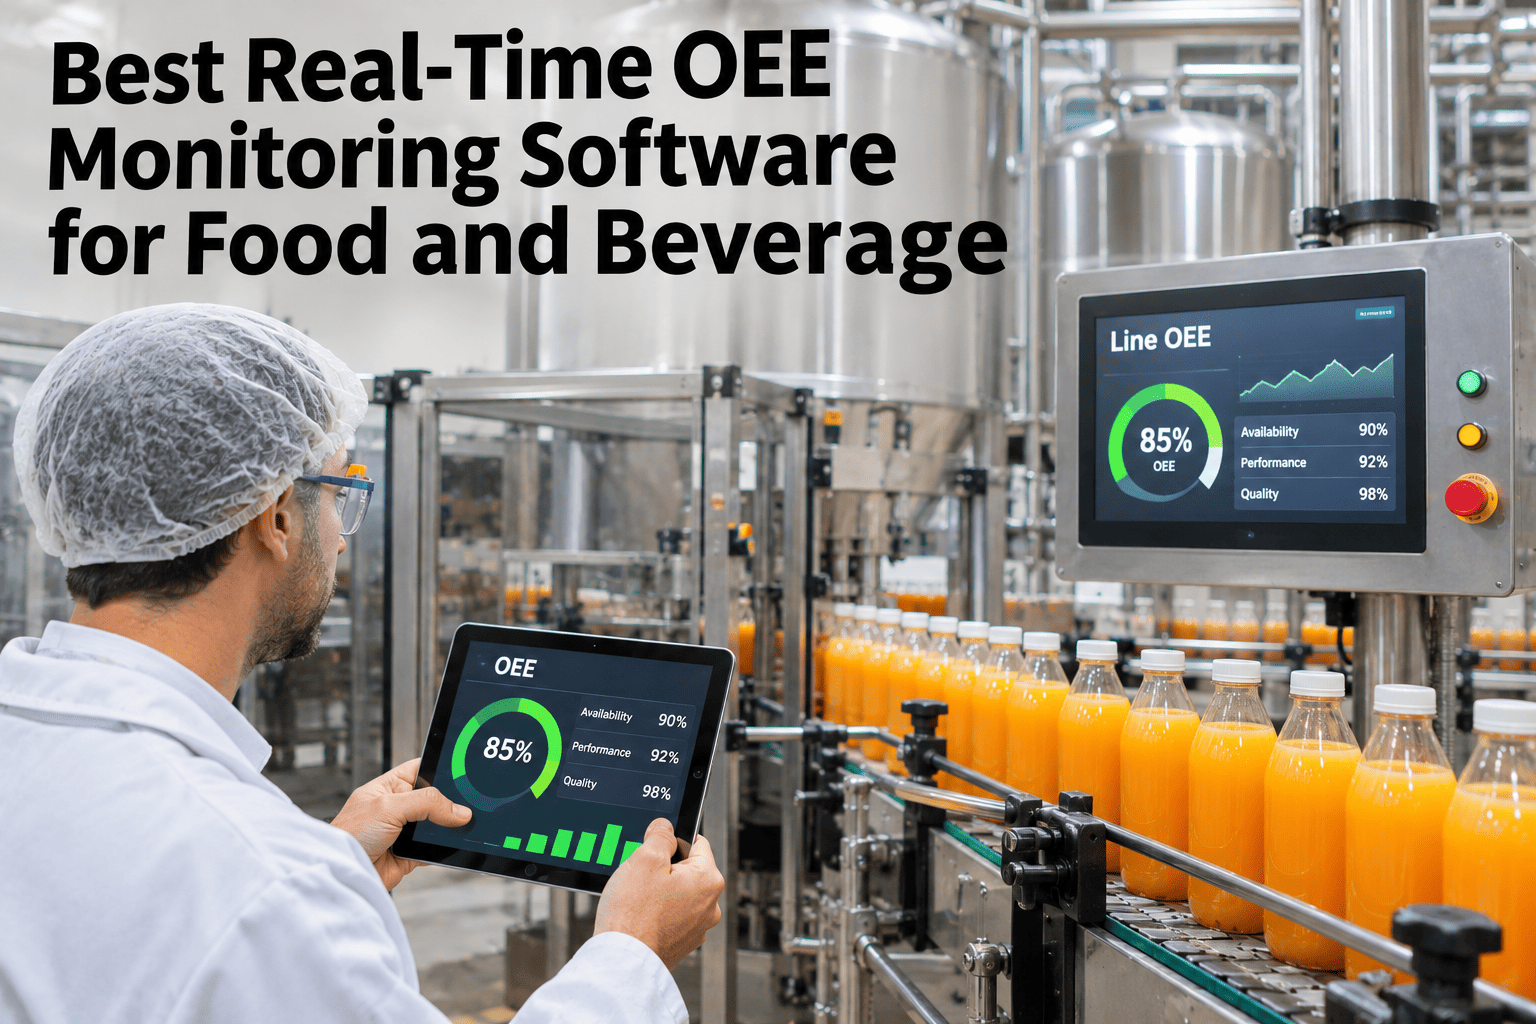
Picture a plant director opening the morning report and seeing "OEE: 61%" with nothing underneath it. That single number cannot tell her whether the line lost time to a jammed conveyor, a slow changeover, or product sitting out of spec on the belt. Food plants that still read OEE as one flat percentage are reading a symptom, not a diagnosis, and the six distinct losses hiding inside that number are exactly where the recoverable output lives. This piece walks through what those six losses actually look like on a real shift, how a director turns that picture into a weekly habit, and what the gap between an average and a world-class line is really worth. You can also walk a sample loss breakdown with our engineers before reading further.
Food & Beverage OEE — 2027 Field Guide
One Number Hides Six Stories. Read All Six.
iFactory, an on-premise AI platform for production monitoring, splits a flat OEE percentage into the six big losses, ranks them by cost, and ties each one back to the shift, line and reason behind it — so a director's morning read takes thirty seconds, not thirty questions.
100%Planned time
-9%Breakdowns
-13%Changeovers
-6%Minor stops
-9%Reduced speed
-3%Defects & yield
60%What's left: live OEE
The six losses, plainly
What Each of the Six Big Losses Actually Looks Like on the Floor
Each loss category has a distinct fingerprint, and a director who can recognize the fingerprint can guess the fix before the data even confirms it.
01
Breakdowns
Unplanned stops from equipment failure — the loss everyone notices first because it's loud and obvious.
02
Setup & changeover
Planned stops to switch SKU, clean, or adjust — quiet, routine, and usually the single biggest category.
03
Minor stops
Stops under a few minutes that never make it into a work order, so they vanish from every report except a live one.
04
Reduced speed
The line runs, but under rated speed — the loss nobody logs because nothing technically stopped.
05
Process defects
Product made but rejected at in-line inspection — a loss that already consumed raw material and energy.
06
Reduced yield
Start-up and ramp losses before the line reaches stable output — easy to miss because it happens at the edges of a shift.
Sourced benchmark
Where Food & Beverage Lines Actually Sit in 2027
The 2026 OEE Benchmark Report, built from direct-sensor measurement across 450 plants in 30 countries, is the clearest external reference point available for a food plant comparing itself honestly (TeepTrak, 2026).
58%
Food & beverage median OEE, direct-sensor measured
82%
World-class top-decile for food & beverage lines
36%
Share of total losses from changeovers, the largest single category
Plants moving from paper to direct-sensor measurement typically uncover five to fifteen percentage points of losses that were simply invisible before — not new problems, just problems nobody could previously see (TeepTrak, 2026 OEE Benchmark Report).
Maturity model
Four Stages of OEE Visibility Maturity
Stage 1 — PaperHourly handwritten rounds, reconstructed end of shift
Stage 2 — Blended digitalOne automated OEE number, still no loss breakdown
Stage 3 — Six-loss visibilityLive breakdown by category, ranked and reviewed weekly
Stage 4 — PredictiveLoss patterns flag at-risk shifts before they happen
Most food plants sit at Stage 1 or 2 today. The jump from Stage 2 to Stage 3 — adding the loss breakdown to an OEE number that already exists — is usually the cheapest, fastest win available, since the underlying data is often already being collected.
A composite scenario
The Line Everyone Blamed on the Filler
A mid-size beverage plant had spent two quarters trying to speed up its filler, convinced it was the constraint, because the filler's OEE number was consistently the lowest on the daily report. A six-loss breakdown told a different story: the machine itself ran at 97% of rated speed whenever it was actually filling.
The real drag was changeover time, not mechanical performance. Once changeovers were isolated and timed separately, the fix was a standardized changeover sequence, not a faster filler — the kind of misdiagnosis a blended OEE number invites every time. Illustrative pattern, not a specific customer result.
Comparison
Blended OEE vs Six-Loss Visibility
| Dimension | Blended OEE | Six-Loss Visibility |
|---|
| What you see | One percentage | Six ranked categories |
| Where the fix comes from | Guesswork, often the loudest complaint | The category actually costing the most |
| Minor stops | Usually invisible | Captured and totaled automatically |
| Weekly review | "Why was OEE low this week?" | "Changeovers cost us 13 points — here's the plan" |
Who reads what
The Same Screen, Three Different Readings
Plant director
"Which line is losing the most, and is this week better or worse than last?"
Line supervisor
"Which category is driving today's number, so I know where to walk first?"
Reliability engineer
"Give me the sensor trail behind the breakdown category for the last month."
A good loss visibility screen answers all three questions from the same underlying data, at the depth each person actually needs, rather than forcing an engineer's detail view on a director with thirty seconds to spare.
Expert review
What an Operations Engineer Would Check First
Holds up
Splitting OEE into the six big losses is established TPM practice; making it live rather than monthly is the genuine upgrade.
Watch for
A dashboard with attractive charts but no link back to a work order or quality hold — visibility without an action path changes nothing.
Do next
Start on the line with the worst reported OEE, since it usually hides the clearest misdiagnosis and the fastest win.
FAQ
What Food Plant Directors Ask About OEE Loss Visibility
What are the six big losses in OEE?
Breakdowns, setup and changeover, minor stops, reduced speed, process defects, and reduced yield. Together they split availability, performance and quality into causes a team can act on, instead of one blended score.
See your own six-loss breakdown on a short call.
What is a realistic OEE target for a food plant in 2027?
Median food and beverage OEE under direct-sensor measurement is 58%, with world-class top-decile at 82% (TeepTrak, 2026). Most plants should close the gap in stages, since the first points usually come from visibility alone, before any capital spend.
Discuss a realistic target for your line.
Why is changeover loss usually the biggest category?
Changeovers account for roughly 36% of total losses in food and beverage, the largest single category, because shared lines run frequent SKU switches and each switch carries setup, cleaning and verification time (TeepTrak, 2026). Standardized procedures and live timing close this gap fastest.
How is loss visibility different from a standard OEE report?
A standard report shows yesterday's OEE after the fact. Loss visibility shows the six categories as they happen, so a supervisor can respond mid-shift instead of reading about a problem the next morning.
Ask how live data differs from your current reporting.
Does this require new sensors on old equipment?
Not always. Many PLCs and SCADA systems already generate the needed signals; the gap is usually in connecting and standardizing that data rather than adding hardware.
Review your existing equipment with our engineers before buying anything new.