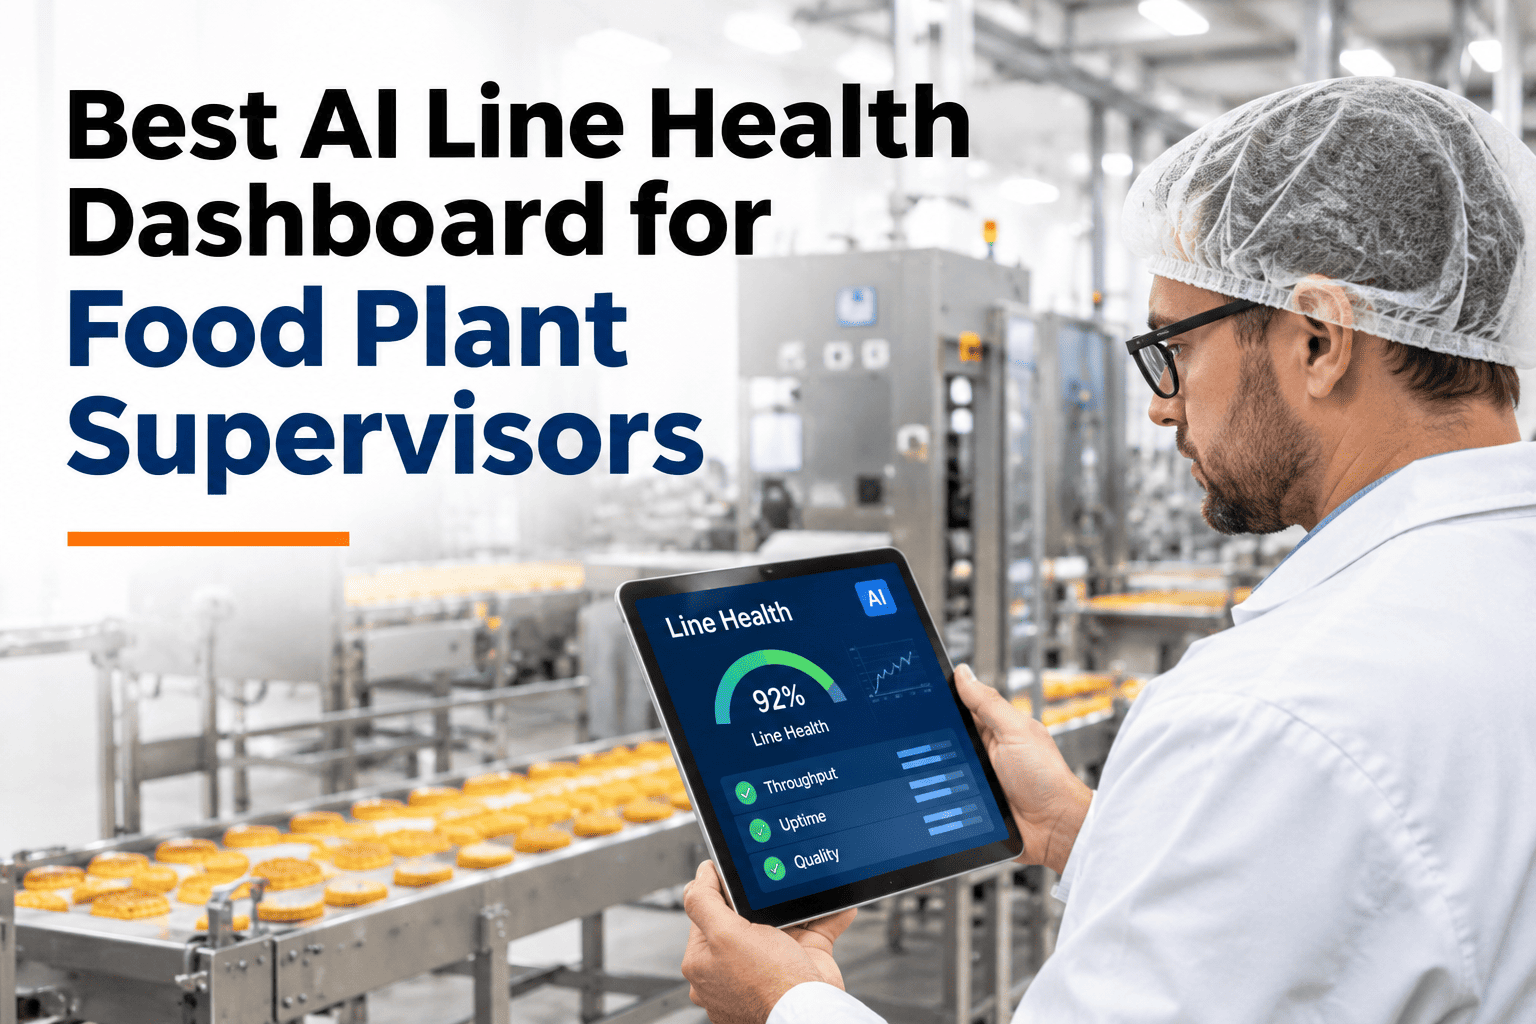
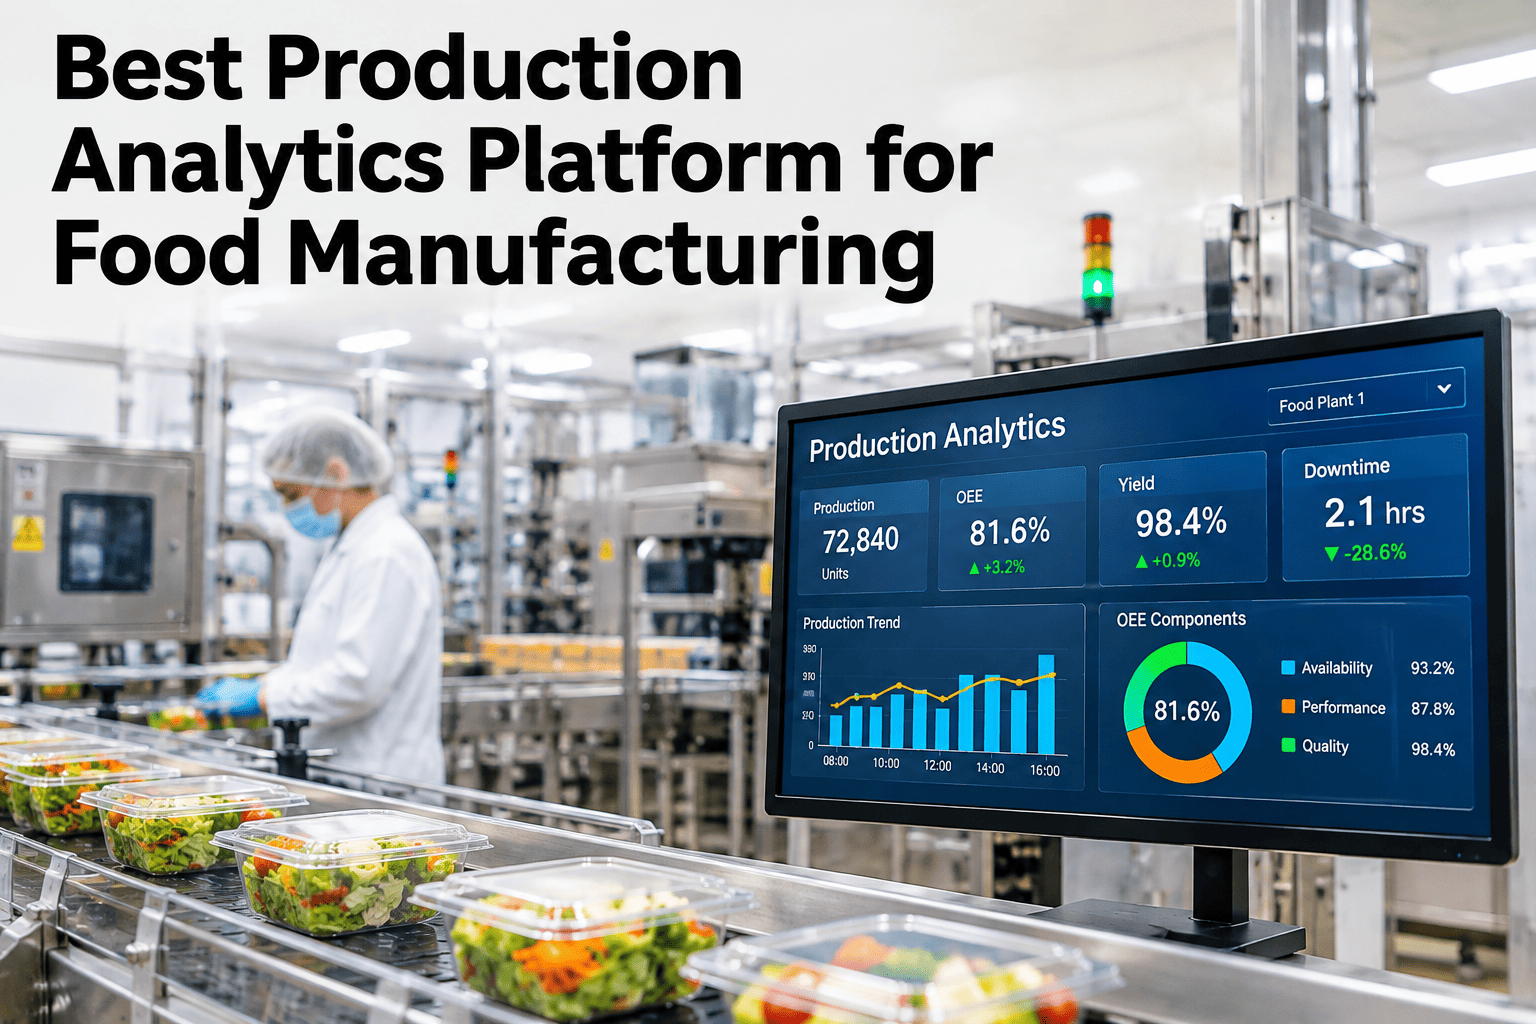
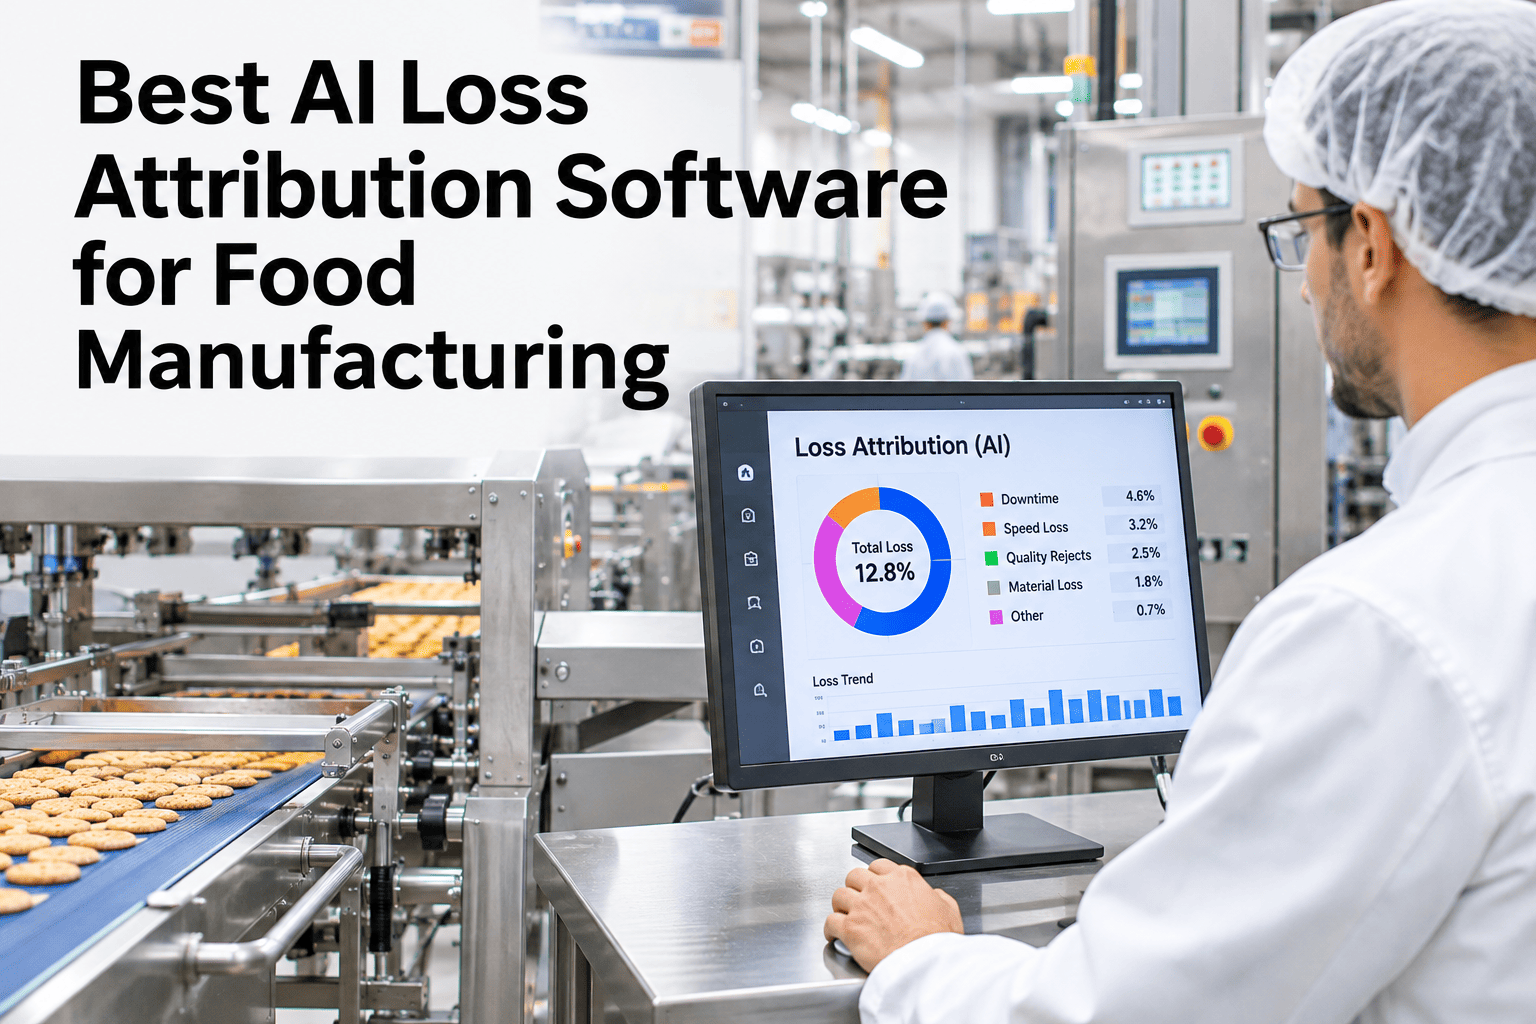
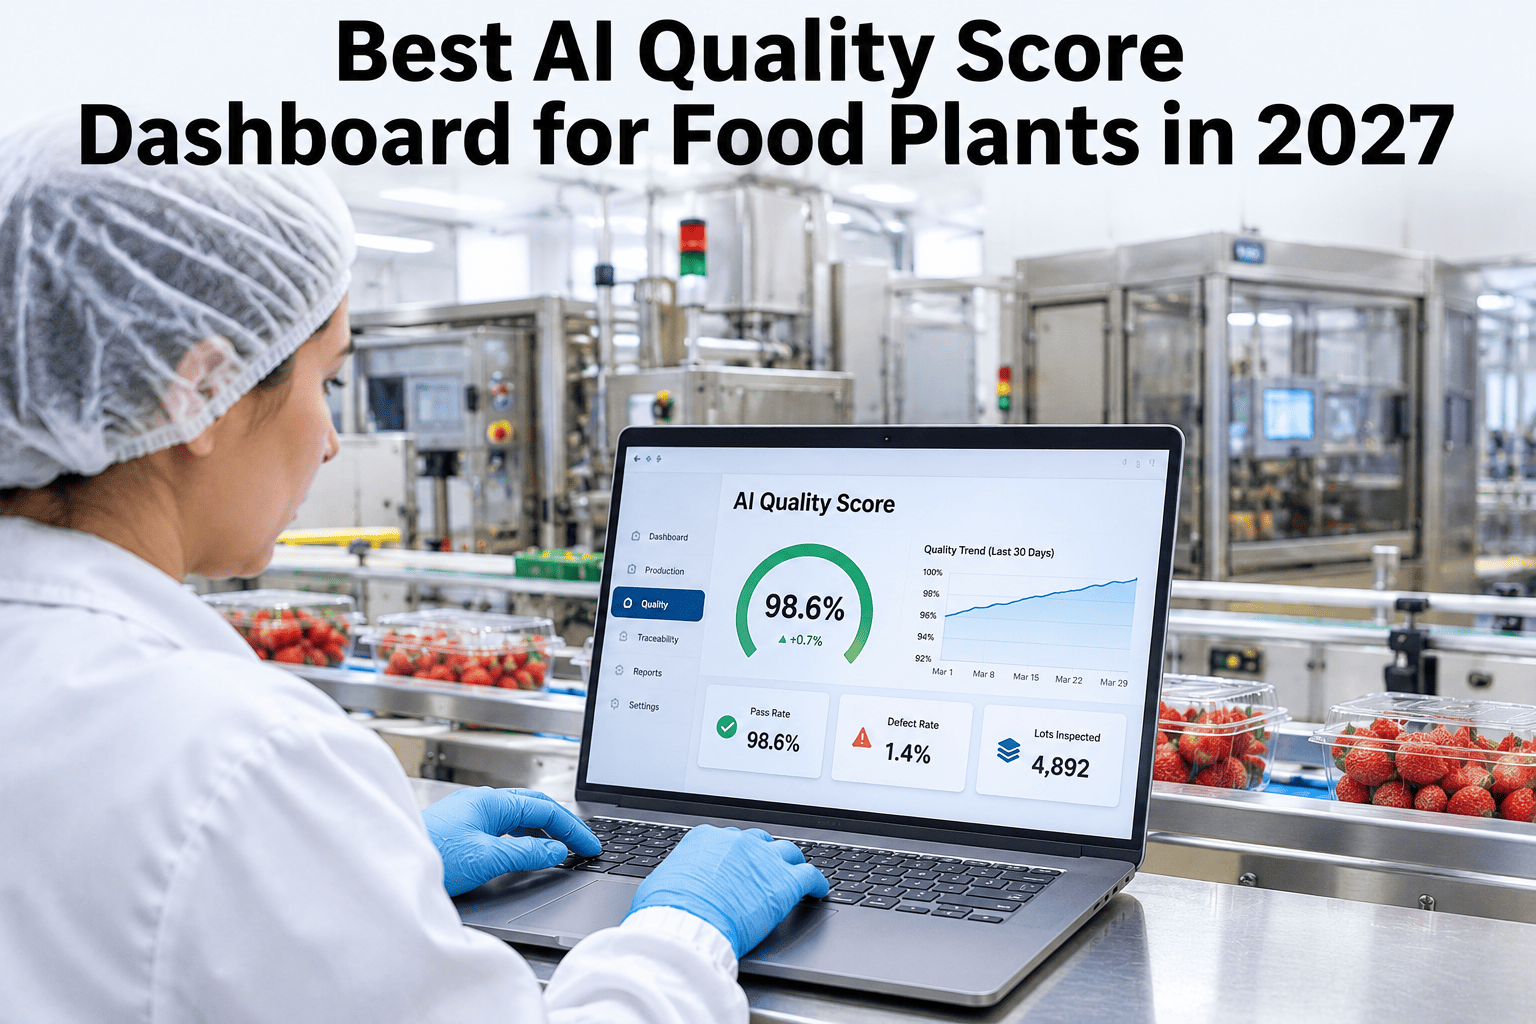
By the time a supervisor sees that the shift missed its target, the loss already happened and nothing can be done except write the incident report. AI production loss prediction flips that timing: it looks thirty minutes ahead at the line's current speed, stops and quality trend, and flags the shift that is about to fall short while there is still time to act. That one window, acting before instead of after, is the entire difference between a prevented loss and a documented one. Plants wanting to see their own line's next thirty minutes predicted can watch a live look-ahead run against their own shift data with the iFactory AI team.
See the Shift's Loss Thirty Minutes Before It Happens
iFactory AI, an on-premise AI platform for manufacturing, predicts the shift's likely production loss thirty minutes ahead, so a supervisor can act before the damage is done instead of explaining it afterward.
Why "After the Shift" Reporting Cannot Prevent a Loss
A standard production report tells a plant exactly what happened, hours or a full shift after the window to fix it closed. The report is still valuable for history, but it answers the wrong question for the supervisor standing on the floor right now, who needs to know what is about to happen, not what already did.
What the Look-Ahead Actually Watches
Test the Model Against a Shift You Already Know
Give iFactory AI a shift you remember having problems, and see whether the thirty-minute look-ahead would have flagged it in time.
Why Thirty Minutes Is the Right Window, Not an Arbitrary One
A shorter window, say five minutes, leaves barely enough time for a supervisor to walk across the floor, let alone diagnose and fix anything. A much longer window, say four hours, loses the accuracy that makes a prediction worth trusting, because too much can change on a food line in that span. Thirty minutes sits in the range where a model can still see a meaningful pattern forming while leaving genuine time to intervene before the loss is locked in.
That said, the right window is not universal. A line with longer, slower-building failure modes, such as a gradual bearing wear pattern, can support a longer look-ahead reliably, while a line prone to sudden jams may need a tighter window to stay accurate. Tuning the window to the line's own failure patterns, rather than applying one number everywhere, is part of getting the prediction right.
Matching the Response to the Risk Level
| Predicted risk | Likely cause | Suggested action |
|---|---|---|
| Low | Minor speed drift within normal range | Monitor, no action needed yet |
| Moderate | Stop frequency rising above baseline | Supervisor checks the line in person |
| High | Quality and speed signals both trending down | Pull in maintenance or adjust the run immediately |
A Shift With and Without the Look-Ahead
What a Month of Predictions Reveals That One Shift Cannot
A single prevented loss is a good story, but the real value of a look-ahead model shows up after a month of alerts have accumulated. Patterns emerge across shifts that no individual supervisor would ever notice on their own, such as a particular machine's risk level rising every time a specific upstream changeover runs beforehand, a connection that only becomes visible once enough alerts are logged and compared.
That accumulated pattern becomes its own kind of early-warning system, feeding back into maintenance planning and scheduling decisions well beyond the original thirty-minute window the model was built to predict. What starts as a tool for one supervisor's shift gradually becomes a resource the whole plant uses to plan around its own known weak points.
Mistakes That Undermine a Loss Prediction Rollout
What a Plant Needs Before the First Prediction Fires
A look-ahead model does not need months of history to start producing useful signal. It needs a clear baseline of what normal looks like for each shift and product, and a connection to the speed, stop and quality data most plants already generate through MES, PLCs or line sensors. The real setup work is agreeing which signals matter for each line, not building anything from scratch.
A Shift That Would Have Missed Target, and Didn't
Picture a bottling line thirty minutes into a shift, where stop frequency on the capper has quietly doubled against its normal baseline while output still looks acceptable on the floor. A standard report would not flag anything until the hourly tally came up short. A look-ahead model catches the pattern early, flags moderate risk, and a supervisor walks the line, finds a worn cap chute guide and swaps it before the small stops become a thirty-minute jam. The shift still hits target, and the only record of the near-miss is the alert log, not a missed order.
What an Operations Director Would Check First
What Plant Teams Ask About Loss Prediction
Give Your Supervisors a Thirty-Minute Head Start
Book a session with iFactory AI to see production loss prediction running against your own line's data.