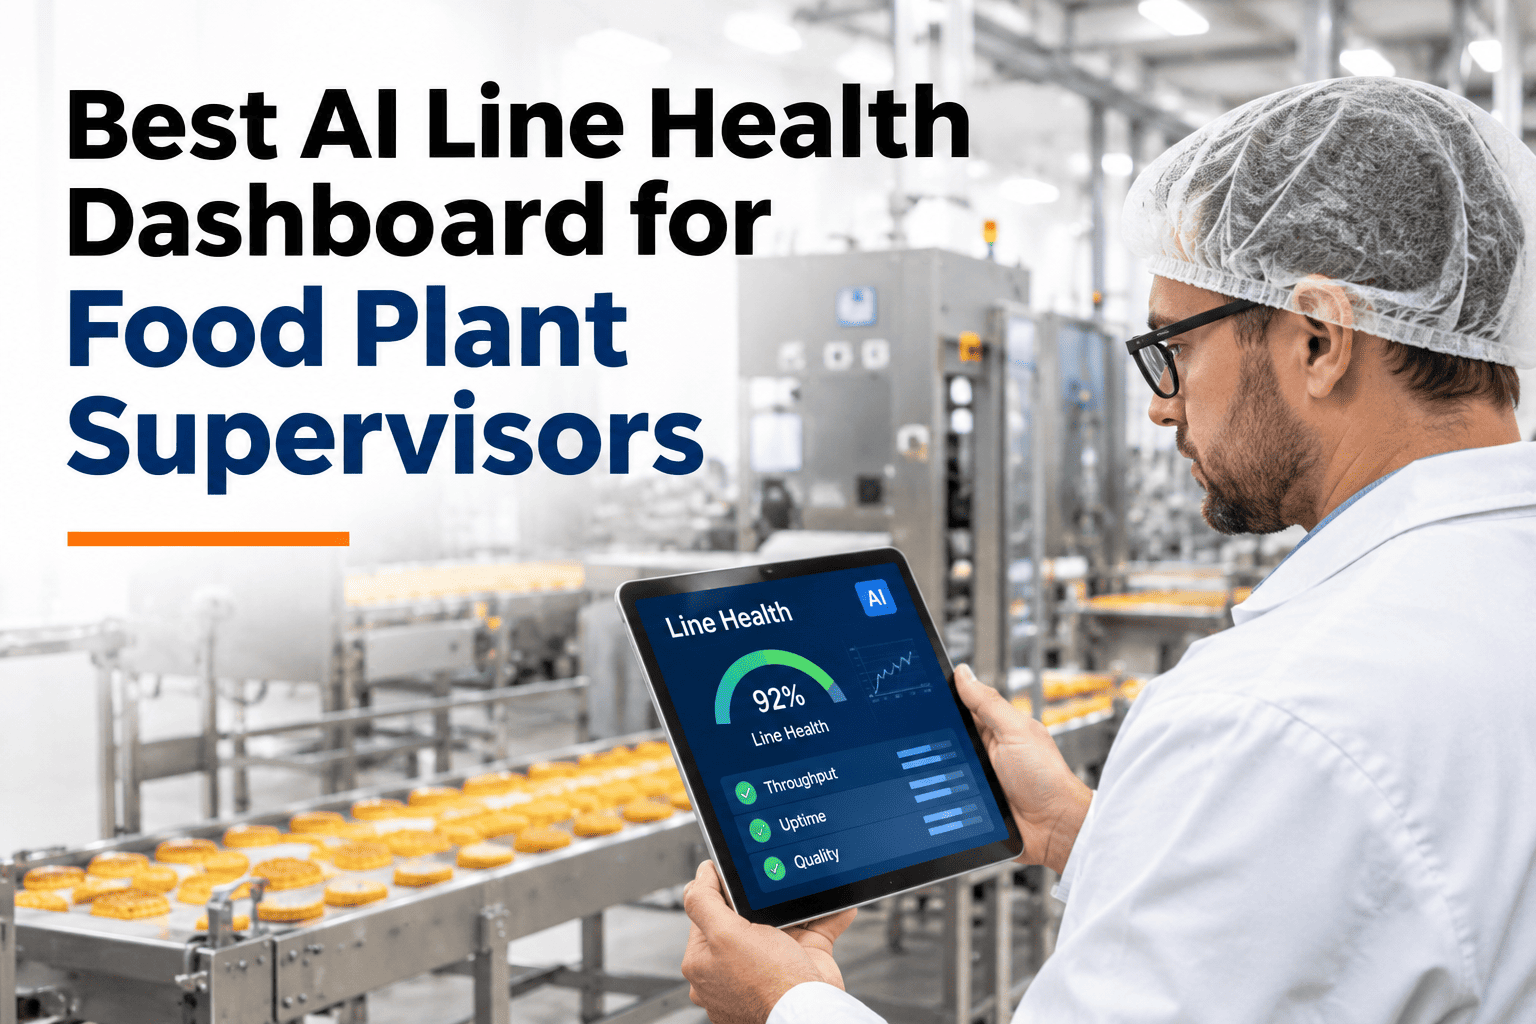
A food plant supervisor walking the floor is doing manual aggregation in their head — checking the filler's speed, the metal detector's reject count, the packer's jam log and the cooler's temperature trend, then trying to hold all of it together into a sense of how the shift is actually going. A single line health score, built from exactly those signals, replaces that mental math with one number and a short list of what to actually do about it. iFactory AI's food operations team can show a line health score running against your own shift data before your next walk-through.
A Supervisor Shouldn't Have to Hold the Whole Shift in Their Head
A line-level health score, a next-shift risk flag and the top three actions that would move the number most — on the tablet of every supervisor, updated continuously.
Why Manual Monitoring Runs Out of Attention Before the Shift Does
A supervisor overseeing a filling line, a metal detector, a packer and a cooling system is effectively running mental aggregation across four or five separate systems, each with its own normal range, its own alert habits and its own blind spots. That works reasonably well for the first hour of a shift and degrades steadily after, not because the supervisor isn't paying attention, but because holding five independent data streams in working memory for eight hours isn't something any person can sustain reliably.
Each piece of equipment reports its own status, with no combined picture.
A supervisor has to mentally weigh several separate signals into one judgment.
Problems get noticed once they're already visible, not while they're still developing.
The next shift's supervisor starts from zero instead of where the last one left off.
What Goes Into the Health Score
The score should weight the signals that actually predict a problem, not just the ones that are easiest to measure. Our team can walk through how the score would weight your specific line's equipment.
Rising short-stop frequency on any station weighs into the score.
Vision and metal-detection reject trends factored against normal baseline.
Cooler temperature, humidity or other process-critical readings in range.
Unresolved work orders on equipment feeding this line, weighted by age.
Health Score Ranges and What They Mean
| Score Range | What It Signals | Supervisor Action |
|---|---|---|
| 85–100 | Line running within normal parameters | Routine monitoring |
| 65–84 | One or more signals drifting from baseline | Review the top-three action list |
| Below 65 | Multiple signals elevated or one severe | Immediate investigation before next shift |
See This Score Running on Your Own Line Today
Connect one line's existing equipment data and see a health score and action list generated from your current shift.
A Composite Scenario: The Score That Caught What the Walk-Through Missed
Picture a supervisor completing a routine floor walk at the start of a shift, with every station looking normal to the eye and no obvious reason for concern.
The health score flagged a gradual micro-stop increase on one filler nozzle that hadn't yet become visually obvious on the floor, giving the supervisor time to schedule a check before it escalated into a bigger stop later in the shift. The visual walk-through alone would likely have missed it until the trend became severe enough to notice directly. The scenario illustrates the value of continuous scoring over a point-in-time check; actual outcomes depend on each line's own equipment and history.
Where iFactory AI Fits
iFactory AI combines micro-stop trends, quality reject rates, environmental conditions and open maintenance items into one continuously updated line health score, with a next-shift risk flag and the top three actions most likely to move the number.
The score reflects current conditions, not a snapshot from the morning meeting.
The top three items are ranked by impact, not listed alphabetically.
Built for a supervisor walking the floor, not a desk-bound report.
Frequently Asked Questions
It combines weighted signals — equipment micro-stop trends, quality reject rates, environmental readings and open maintenance items — into one composite score, with weighting tuned to which signals have historically predicted a problem on that specific line. Review the weighting approach for your equipment mix.
A projection of whether current trends, if unaddressed, are likely to cause a problem severe enough to affect the next shift, giving the outgoing supervisor something concrete to flag at handover beyond a general sense that something seemed off. Ask how risk projection works.
They're ranked by estimated impact on the health score, so a supervisor with limited time between other duties sees the highest-leverage items first rather than a long undifferentiated list. Review how actions are prioritized for your line.
No, it aggregates signals from existing systems into one score rather than replacing the equipment-level monitoring each system already does, so specialists still have their own detailed views available. Check compatibility with your current systems.
Yes, the score's weighting and the action list's priorities should reflect each line's own equipment mix and historical failure patterns, rather than applying one generic formula across lines with very different risk profiles. Discuss customization for your specific lines.
Give Every Supervisor One Number and Three Actions
iFactory AI combines equipment, quality and environmental signals into one line health score, with the top three actions ranked by impact.