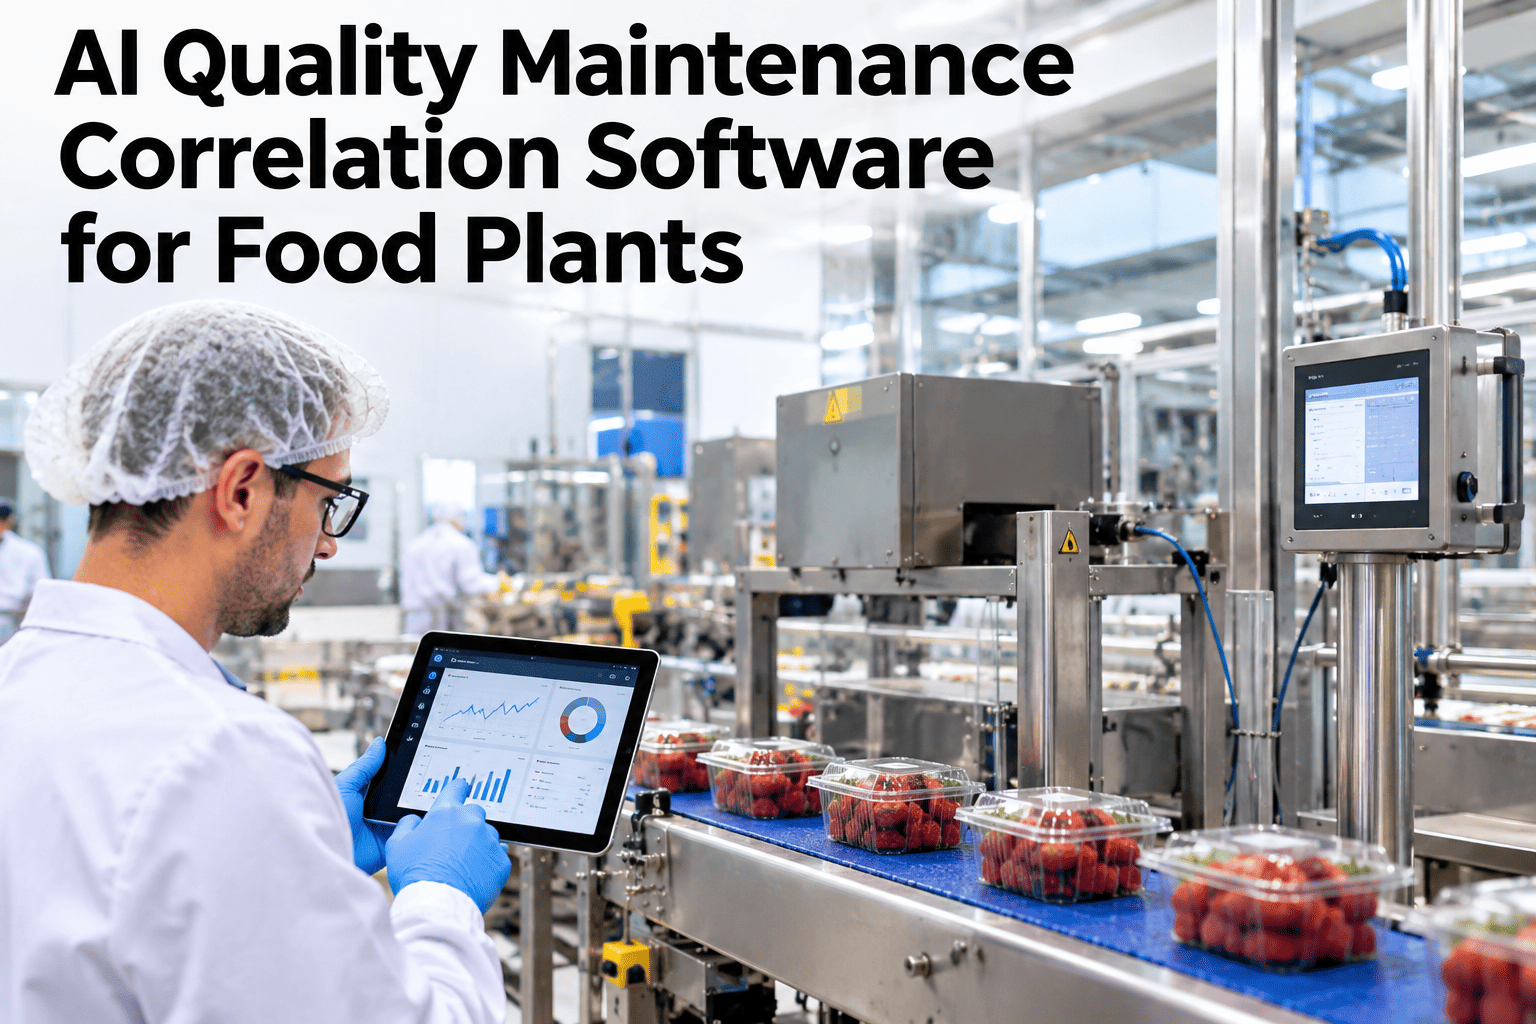
Somewhere in most food plants, a pump's current draw has been drifting for weeks, and the only place that drift is showing up is a slow, easy-to-dismiss rise in the quality team's reject log. Nobody is lying about the data — quality and maintenance are both recording exactly what they see. The problem is that nobody is looking at both logs on the same timeline, so the connection between a developing mechanical fault and a developing quality trend stays invisible until the asset actually fails. AI quality-maintenance correlation software exists to put those two timelines in front of the same person, at the same time. You can also see this correlation run against your own data in a short session.
Food Plant Quality & Maintenance — 2027
Your Quality Log Already Knows What's Failing
iFactory, an on-premise AI platform for quality control and predictive maintenance, overlays asset condition, PM history and quality events on one timeline, so RCA teams find the real mechanical cause instead of stopping at the nearest symptom.
Asset condition
Quality events
The correlation lives here
What it is
What Is Quality-Maintenance Correlation?
Quality-maintenance correlation links three data streams that usually live apart — asset condition data (vibration, temperature, current draw), preventive maintenance history, and quality events (rejects, holds, complaints) — so patterns across them become visible instead of hidden in three separate logs.
The value shows up at the moment of RCA: a quality engineer sees a rising reject rate, a maintenance planner sees a routine PM schedule, and neither sees that the rejects started climbing exactly when one pump's vibration signature began to drift.
The gap
Why Cross-Functional Visibility Breaks Down
Poor cross-functional visibility is rarely a willingness problem — quality and maintenance teams generally want to collaborate. It is a systems problem: the data each team needs to see the other's half of the story lives in a different platform, on a different schedule, with no shared identifier connecting an asset to the batches it touched.
Separate systems
Quality holds and work orders sit in different platforms with no shared key.
Different timescales
Quality reviews weekly trends while maintenance reacts to real-time alarms.
No asset-to-batch link
Nobody can trace which specific asset touched which specific rejected batch.
RCA stops early
Without the link, investigations settle for the nearest visible symptom.
A timeline, overlaid
Eighteen Days: How a Quiet Drift Became a Visible Defect
Day 1
Feed pump current draw begins a slow upward drift — invisible on any dashboard set to alarm on hard thresholds.
Day 9
Fill-weight rejects tick up slightly — within normal variation, nobody flags it yet.
Day 14
Reject rate crosses the review threshold; quality opens an investigation into the filler.
Day 18
Correlation check overlays the two timelines — the drift preceded the rejects by nine days. The filler was never the cause.
This is an illustrative pattern, not a specific customer result, but it reflects the kind of gap correlation closes: two true, accurate logs, pointed at the wrong machine, because nobody had overlaid them.
Comparison
Siloed Logs vs a Correlated Quality-Maintenance View
| Dimension | Siloed Logs | Correlated View |
|---|
| Data location | Separate quality and CMMS systems | One linked view by asset and batch |
| Pattern detection | Manual, after the fact | Surfaced automatically as trends form |
| RCA starting point | Nearest visible symptom | Confirmed condition trend |
| Team alignment | Separate conclusions, separate meetings | Shared evidence, one conversation |
How it works
Four Steps From Siloed Logs to a Correlated View
1
Tag every quality event with the specific asset, line and shift it occurred on, not just the product and date.
2
Pull condition data and PM history for that same asset across the same time window.
3
Overlay the two timelines to see whether a condition trend preceded the rise in quality events.
4
Feed the confirmed correlation back into the RCA template so the next investigation starts from evidence, not a guess.
Expert review
What a Reliability Engineer Would Check First
Holds up
Linking condition trends to quality events before a failure is a well-established predictive maintenance principle, not a novel claim.
Watch for
A correlation shown once without repeated validation — one matching pattern is a lead, not proof, until it holds across multiple events.
Do next
Start with the asset tied to your most frequent or costly recurring quality issue, since that is where the correlation has the best odds of paying off fast.
FAQ
What Food Plants Ask About Quality-Maintenance Correlation
What data do we need before correlation is useful?
At minimum, quality events tagged to a specific asset and time, plus condition or PM history for that same asset. Plants without asset-level tagging on quality events usually need to add that first, since it is the shared key the correlation depends on.
Review your current data with our team before starting.
How is this different from a standard CMMS report?
A CMMS report shows maintenance history in isolation. Correlation software overlays that history against quality events on the same timeline, so a trend that would otherwise sit in two separate reports becomes one visible pattern.
Ask how this connects to your CMMS setup.
Can correlation predict a failure before it happens?
It can flag that a condition trend historically precedes a quality event, giving maintenance a lead-time window to act before the defect rate rises further. It is a pattern-based signal, not a guaranteed prediction, and should feed a human decision rather than trigger automatic action.
Does this require new sensors on every asset?
Not necessarily. Many plants already have current, vibration or temperature data flowing from existing PLCs; the gap is usually in linking that data to quality events rather than adding hardware.
Check your existing sensor coverage with our engineers.
Who should own the correlated view, quality or maintenance?
Both teams need access, since the value is specifically in shared evidence replacing two separate conclusions. Most plants set it up as a joint RCA input rather than assigning exclusive ownership to one department.
Discuss ownership and access for your team structure.
Let Your Quality Data Tell You What's Actually Failing
Book a session with iFactory AI to link asset condition, PM history and quality events for your plant and see the correlation on your own data.
Book a Correlation Demo
Talk to Our Support Team