Ask five different people in a food plant how healthy a specific piece of equipment is and you'll likely get five different answers, ranging from a technician's gut feeling to a spreadsheet nobody has updated since last year's shutdown. That inconsistency makes it nearly impossible to compare risk across a hundred different assets or defend a capital request with anything more convincing than an anecdote. An asset health score model solves this by combining PM adherence, failure trend, condition data, and criticality into a single number that means the same thing whether you're looking at a mixer or a boiler. Plants ready to replace subjective asset assessments with a consistent score can connect with iFactory support to see how the model is built.
One Number That Actually Tells You Which Asset To Worry About
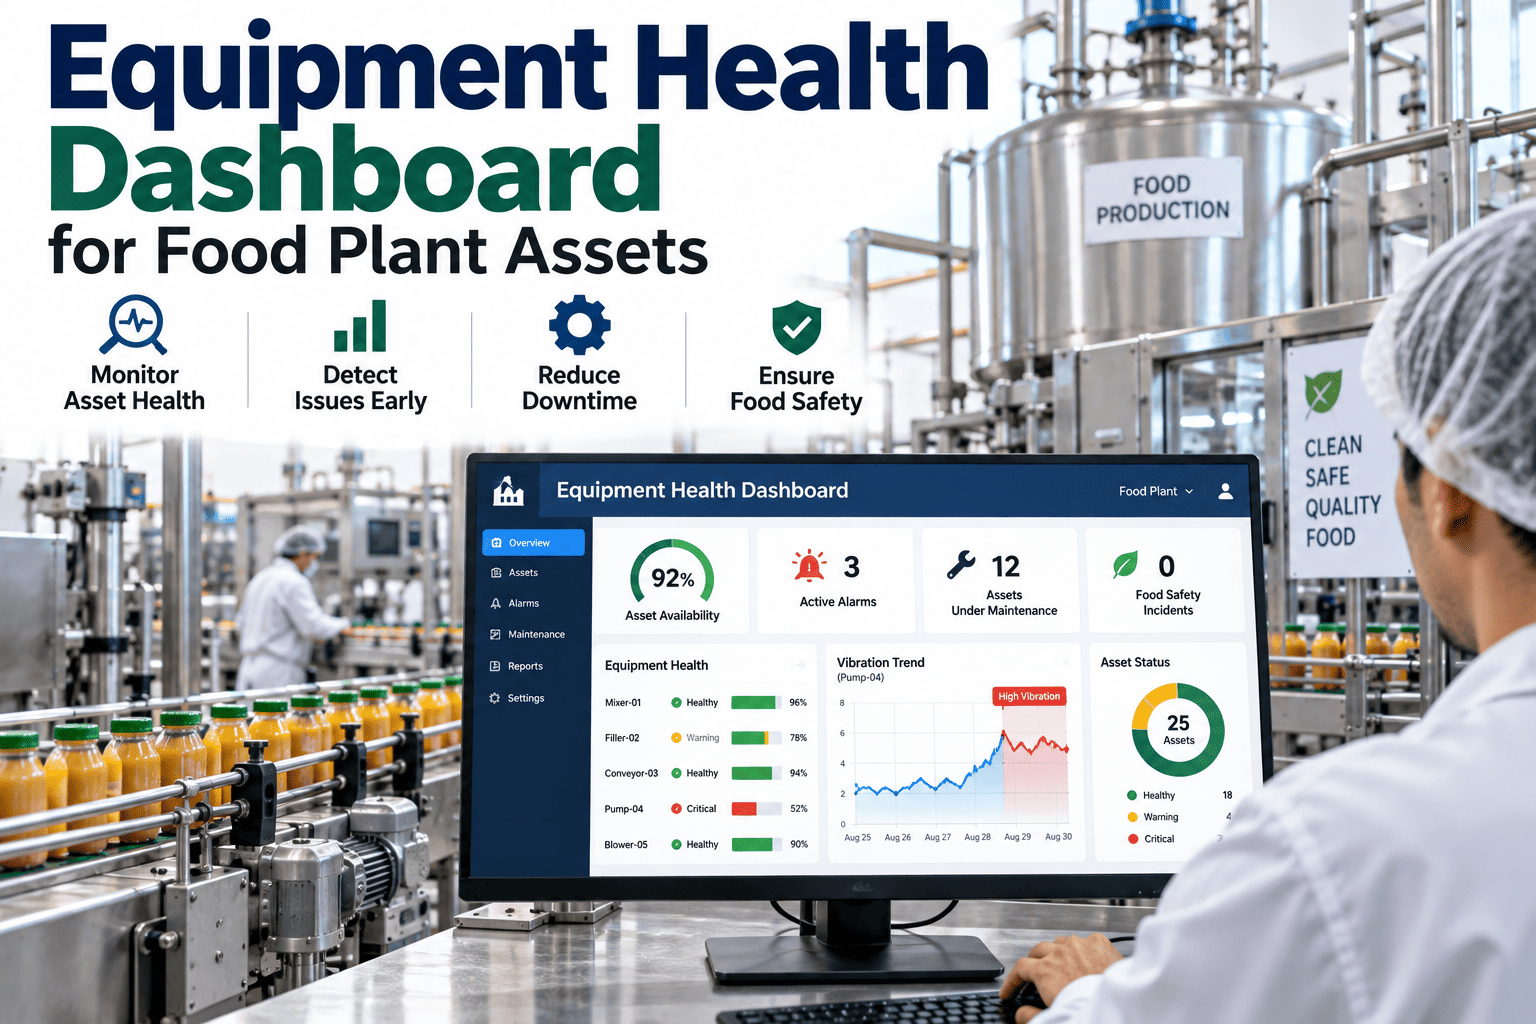
iFactory's asset health score blends condition data, PM history, failure trends, and criticality into a single 0-100 rating, so every asset in your plant can be compared on the same scale.
What The Score Actually Means At Each Band
A health score is only useful if the number maps to a clear, consistent action. Rather than a vague indicator, each band of the scale is tied to a specific level of attention and a specific kind of decision.
| Score Band | What It Indicates | Recommended Action |
|---|---|---|
| 85-100 | Asset performing at or above expected reliability for its age and duty | Standard PM schedule, no additional monitoring required |
| 65-84 | Early signs of wear or drift, still within acceptable operating range | Increase condition monitoring frequency, watch trend closely |
| 40-64 | Meaningful degradation with rising failure probability | Schedule targeted repair or component replacement within the current cycle |
| 0-39 | High risk of near-term failure or already showing repeated issues | Prioritize for immediate intervention or replacement planning |
The Four Inputs That Build The Score
A health score is only as trustworthy as the data feeding it, which is why a credible model draws from several independent sources rather than a single metric that can be misleading on its own.
PM Adherence And Findings
Whether scheduled maintenance has actually been completed on time, and whether those PMs have been finding and correcting real issues, factors directly into the score.
MTBF And Failure Trend
A shortening interval between failures is one of the clearest signals that an asset's underlying condition is deteriorating faster than its maintenance plan assumes.
Condition Monitoring Data
Vibration, thermal, and other condition signals contribute real-time evidence of mechanical state rather than relying solely on historical failure patterns.
Asset Criticality
The same physical condition carries very different urgency depending on whether the asset is a bottleneck line or a redundant backup, and the score reflects that difference.
Building The Model Step By Step
A working health score doesn't appear from a single formula applied once. It is assembled and validated in stages so each input is weighted correctly before the number is trusted for real decisions.
Define Criticality Tiers
Every asset is assigned a criticality tier based on downtime cost, safety impact, and redundancy, giving the score a consistent weighting foundation.
Establish Baseline Data For Each Input
PM history, MTBF, and available condition data are compiled per asset to establish a starting point the model can measure change against.
Weight Each Factor By Asset Type
Different equipment types weigh condition data and failure trend differently, so weightings are tuned per asset class rather than applied uniformly.
Validate Against Known Outcomes
The initial scoring model is checked against assets with known recent failures to confirm the score would have flagged the risk before it happened.
Deploy And Recalculate Continuously
Once live, the score updates automatically as new PM, condition, and failure data arrives, keeping every asset's rating current rather than a static snapshot.
Compare Every Asset In Your Plant On The Same Scale
iFactory builds a health score that combines condition, history, and criticality into one number your whole team can act on with confidence.
A Composite Scenario: The Plant That Finally Ranked Its Own Risk
A frozen food processor had a long list of aging equipment and a maintenance team that could describe individual asset concerns in detail but had no consistent way to rank which of dozens of aging machines actually posed the highest risk. After implementing a health score model across its production and packaging equipment, the plant discovered that several assets long assumed to be its biggest risks actually scored in the healthy range, while a handful of less-discussed machines scored in the critical band due to a combination of rising failure frequency and heavy criticality weighting.
Redirecting the next capital cycle's budget toward the newly identified high-risk assets, rather than the ones that had simply generated the most conversation, avoided at least one likely failure on a bottleneck line within the following year.
Mistakes That Undermine A Health Score Model
Relying On A Single Input
A score built purely on failure history or purely on condition data misses the half of the picture that the other source would have revealed.
Ignoring Criticality Weighting
Treating a redundant, low-consequence asset the same as a bottleneck asset with identical mechanical condition produces a misleading priority ranking.
Calculating The Score Too Infrequently
A health score refreshed only once a year fails to catch the kind of rapid degradation that condition monitoring is specifically designed to detect early.
Never Validating Against Real Failures
A model that has never been checked against actual past failures risks giving false confidence in a scoring formula that doesn't reflect real risk.
Is Your Plant Ready To Build A Health Score Model
Your PM and work order history is captured digitally
A CMMS with reasonably complete PM and repair records gives the model enough history to calculate meaningful trends.
Some condition monitoring data already exists
Even periodic vibration or thermal readings on your most important assets are enough to start incorporating condition data into the score.
Asset criticality has been defined, even informally
A rough criticality tier for each asset is enough to weight the score correctly from the start, with refinement possible later.
Leadership wants a defensible way to prioritize capital and labor
A health score delivers the most value when it directly informs where budget and technician hours actually get allocated.
Frequently Asked Questions
How accurate is a health score compared to an experienced technician's judgment?
A well-built health score is designed to complement technician judgment rather than replace it, since experienced staff often notice subtle cues a model may not capture, while the model can consistently track dozens of assets at once without fatigue or bias. In practice, the most reliable outcomes come from combining both, using the score to prioritize attention across a large asset base and technician insight to interpret and validate what the score is showing on any individual machine. Over time, comparing the score's predictions against real outcomes helps refine the model's weighting and builds trust in the number.
What happens if we don't have condition monitoring data for every asset?
Assets without condition monitoring data can still be scored using PM adherence, failure trend, and criticality alone, though the resulting score will be somewhat less precise than one that includes real-time condition signals. Most plants prioritize adding condition monitoring to their highest-criticality assets first, since that's where the added precision matters most, while lower-priority equipment can be scored adequately on maintenance and failure history alone in the meantime.
How often should the health score be recalculated?
Most plants benefit from a weekly or near-continuous recalculation for critical assets, since new PM completions, condition readings, and any failures should be reflected in the score promptly enough to inform near-term decisions. Lower-criticality assets can often be recalculated on a longer cycle without losing much practical value, since their risk profile tends to change more slowly and less frequently requires urgent action.
Can the health score be used to justify capital replacement budgets?
Yes, a consistent score across the full asset base gives capital planning teams a defensible, data-backed way to rank replacement priorities instead of relying on which asset generated the most recent complaint or conversation. Because the score incorporates criticality alongside condition and history, it naturally surfaces the assets where continued investment in repair no longer makes sense compared to planned replacement.
Does this integrate with the CMMS or EAM system we already use?
Yes, the scoring model is designed to pull PM, work order, and condition data from your existing CMMS or EAM rather than requiring a separate system of record, and the resulting scores can be surfaced back into that same platform for your team to act on. This keeps the health score embedded in the daily workflow your maintenance and reliability teams already use. Book a demo to see how the score connects to the systems you already run.
Give Every Asset A Score You Can Actually Act On
iFactory combines PM history, condition data, failure trend, and criticality into one consistent score across your entire plant.