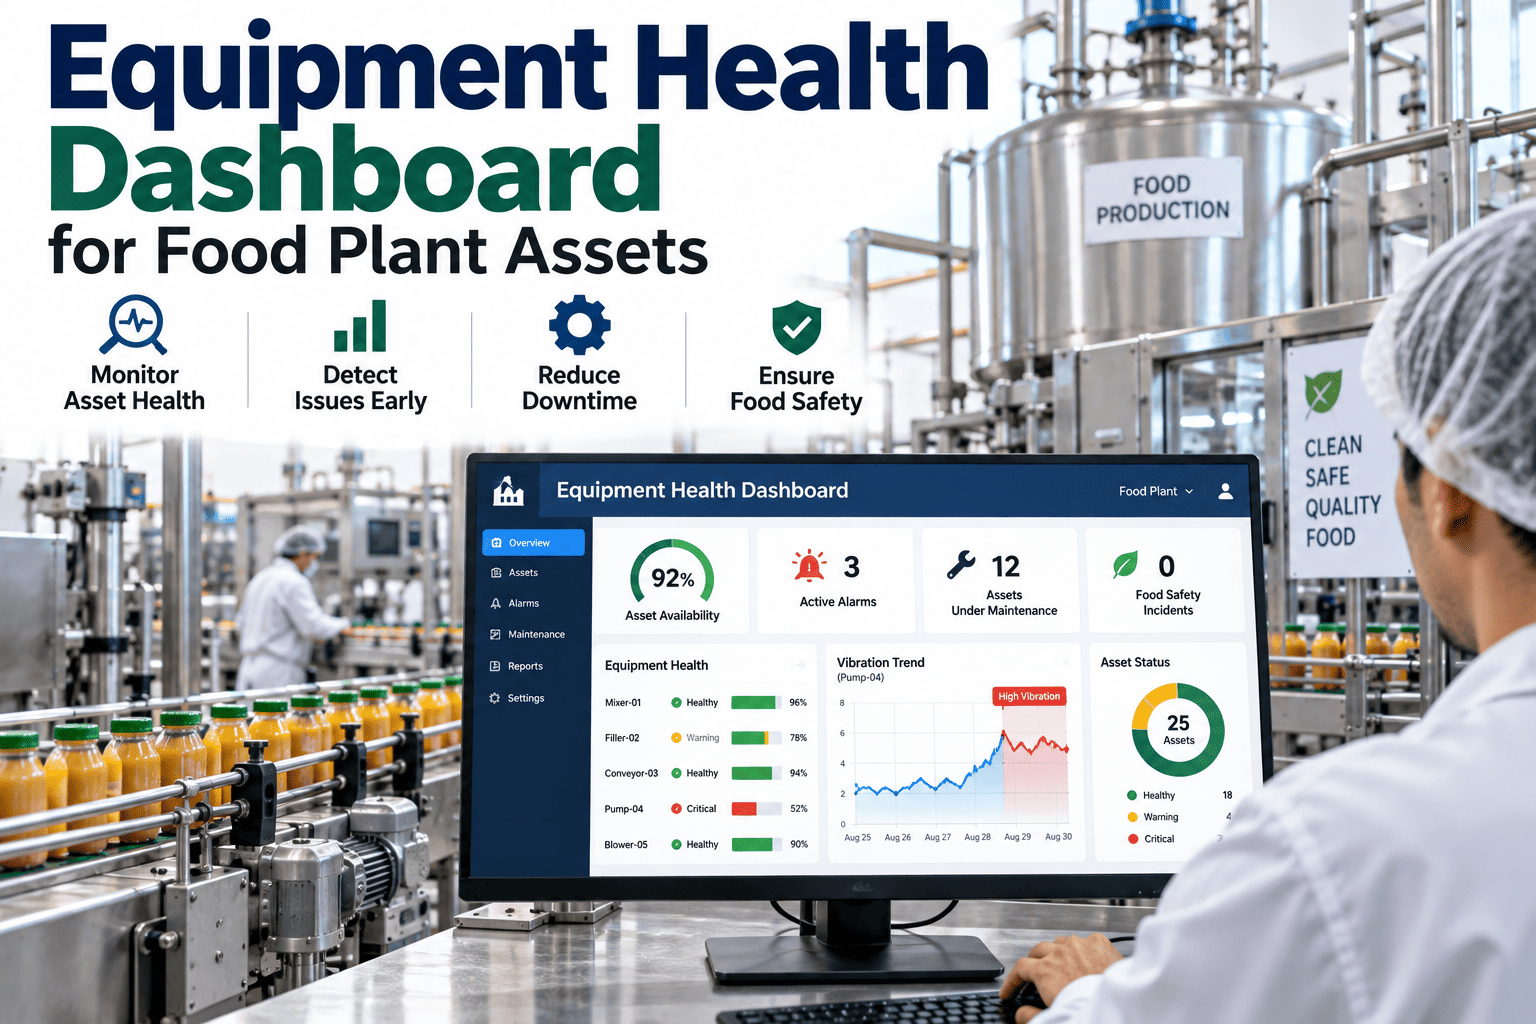
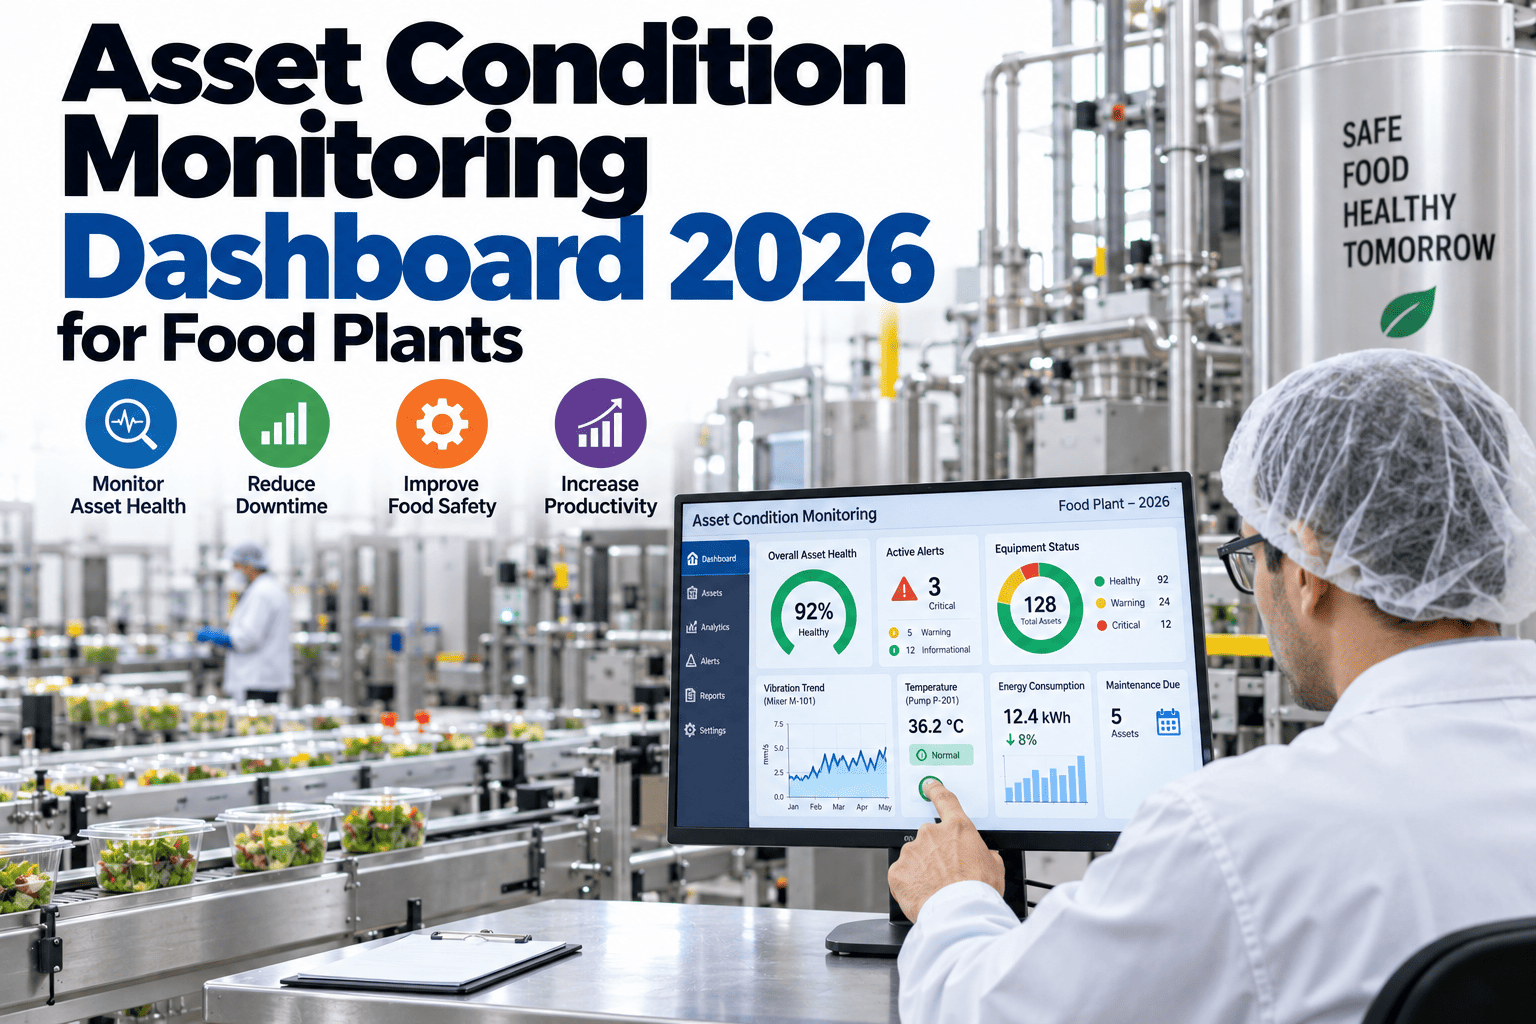
A motor doesn't fail the instant it fails — it fails after weeks or months of gradually rising vibration, slowly climbing temperature, and small shifts in current draw that, viewed individually, never cross an alarm threshold. A health score view pulls those separate signals together into one number per asset, so a maintenance team can see a piece of equipment quietly declining long before it actually breaks down. Building that view across every critical asset in a facility is the core of how iFactory approaches equipment health monitoring for food plants.
CONDITION MONITORING
Equipment Health Dashboard for Food Plant Assets
Vibration, temperature, current, and predictive maintenance alerts across every critical asset, rolled into one live health-score view built for how food plants actually run equipment.
Why a Single Sensor Reading Is Never the Full Health Story
Looking at vibration alone, or temperature alone, or current draw alone, gives an incomplete picture of an asset's real condition, because equipment failure modes rarely announce themselves through a single signal in isolation. A bearing beginning to wear might show a subtle vibration increase alongside a small temperature rise, neither of which alone would trigger a fixed alarm threshold, but together they represent a meaningfully different condition than either reading would suggest on its own. A health score is designed specifically to combine these signals the way an experienced technician's intuition already does, but consistently and continuously across every asset at once.
The Signals That Feed an Asset's Health Score
Each signal type contributes a different piece of insight into an asset's mechanical and electrical condition, and combining them produces a far more reliable early warning than watching any one in isolation.
Vibration
Captures mechanical wear patterns like bearing degradation, misalignment, and imbalance, often the earliest detectable sign of developing mechanical failure.
Temperature
Tracks thermal signatures across motors, bearings, and drives, where elevated readings often indicate friction, lubrication issues, or electrical resistance problems.
Current Draw
Reflects the electrical load an asset is drawing, where unusual patterns can indicate mechanical strain, developing faults, or process abnormalities upstream.
PdM Model Alerts
Predictive maintenance algorithms layer on top of raw sensor data to flag combinations and trends that individually would not cross any single threshold.
Health Score Bands and What Each One Means for Action
Translating raw sensor data into a single health score only creates value if that score maps clearly to a recommended action. The bands below reflect a common structure for interpreting an asset health score and deciding what response it warrants.
| Health Score Band | Typical Condition | Recommended Action |
|---|
| 90-100 | Operating within normal baseline range | Continue standard preventive maintenance schedule |
| 75-89 | Minor deviation from baseline, early-stage development | Increase monitoring frequency, no immediate intervention |
| 60-74 | Meaningful deviation, developing issue likely present | Schedule inspection during next planned downtime window |
| Below 60 | Significant deviation, elevated failure risk | Prioritize inspection and repair before next production run |
See Live Health Scores Across Your Critical Assets
iFactory connects vibration, temperature, current, and PdM alert data into a single health score view across every critical asset in your facility.
Prioritizing Which Assets to Instrument First
Not every asset in a facility needs the same level of condition monitoring instrumentation, and attempting to instrument everything simultaneously is rarely the most efficient starting point. The sequence below reflects how most food plants prioritize their initial equipment health rollout.
1
Single Points of Failure
Equipment with no redundant backup, where a failure would halt an entire line rather than being routed around, gets priority instrumentation first.
2
Highest Historical Downtime Contributors
Assets that have historically driven the most unplanned downtime hours are natural early candidates, since the potential value of early detection is highest there.
3
Long Lead-Time Replacement Parts
Equipment relying on parts with extended supplier lead times benefits especially from early warning, since there's more value in extra notice before failure.
4
Broader Fleet Rollout
Once the initial high-priority assets are validated and delivering value, instrumentation extends to the broader equipment fleet on a structured schedule.
A Reliability Engineer on Catching a Failure Three Weeks Early
"
We had individual vibration and temperature sensors on our critical motors for years before we ever combined them into a single health score, and honestly, in isolation, neither reading on this particular motor ever crossed the threshold that would have triggered a traditional alarm. What changed was seeing both trending upward together on the same screen, alongside a subtle shift in current draw that our PdM model flagged as statistically unusual for that specific asset's normal operating pattern. None of those three signals alone would have gotten anyone's attention that week. Together, the health score for that motor had dropped from the high 90s into the low 70s over about ten days, which was enough for us to schedule an inspection during our next planned changeover instead of waiting for a scheduled outage months away. We found significant bearing wear during that inspection, well before it would have caused an unplanned failure, and the part we needed happened to have a three-week lead time from our supplier. If we had waited for a traditional single-signal alarm to fire, we would have been down for that lead time in the middle of a production run instead of during planned downtime we already had scheduled.
— Reliability Engineer, Food & Beverage Manufacturing Facility · Manages Condition Monitoring Across 60+ Critical Assets
Calibrating Health Scores to Reduce False Positives
A health score that cries wolf too often quickly loses the trust of the maintenance team that's supposed to act on it, which makes calibration one of the most important parts of a condition monitoring rollout rather than an afterthought handled once and forgotten.
Baseline Over Multiple Cycles
Establishing normal range across several full operating cycles, not just a few days, avoids mistaking legitimate variation for a developing fault.
Account for Product Changeovers
Equipment behaves differently across different product runs, and a health model should recognize these as distinct normal states rather than anomalies.
Review Flagged Alerts Regularly
A recurring review of which alerts led to a real finding versus a false positive feeds directly back into refining the model's sensitivity.
Adjust Thresholds Per Asset Class
A threshold tuned for one equipment type rarely transfers well to another, so calibration should happen at the asset-class level, not globally.
Facilities that invest in this calibration work during the first few months of a rollout consistently report far higher trust in the system afterward, since a technician who has seen a handful of health score alerts turn into real, confirmed findings starts treating every subsequent alert seriously rather than skeptically.
Frequently Asked Questions
How is a health score actually calculated from multiple different sensor types?
A health score is typically calculated by comparing current sensor readings against a learned baseline of normal operating conditions for that specific asset, weighting each signal type according to how strongly it correlates with actual failure risk for that equipment category, then combining the results into a single composite score. The specific weighting and baseline calculation improves over time as more operating and failure history accumulates for a given asset class, which is why health scores tend to become more reliable and precise the longer a monitoring program has been running.
What sensors are typically required to build a meaningful health score for an asset?
A reasonably complete health score generally draws on at least vibration and temperature data as the foundational signals, with current draw monitoring adding significant additional insight for motor-driven equipment specifically. Not every asset requires every sensor type — the right combination depends on the specific failure modes most relevant to that equipment category, and a condition monitoring assessment typically identifies which sensors will add genuine value for each asset rather than instrumenting everything identically regardless of relevance.
How often does the health score update, and is it based on live or periodic data?
Most modern condition monitoring systems continuously stream sensor data, allowing the health score to update in near real time rather than on a periodic batch schedule, which is important for catching a rapidly developing issue before it progresses too far between updates. Some facilities with older or retrofitted sensor infrastructure may have periodic rather than continuous data collection for certain signal types, in which case the health score updates on whatever cadence that specific sensor data becomes available.
Can a health score generate false alarms, and how should the team handle that?
Yes, particularly during the early period of monitoring a given asset before enough baseline data has accumulated to fully distinguish normal operating variation from genuine developing issues. This is why the health score bands above recommend increased monitoring rather than immediate intervention for moderate score declines, giving the team time to confirm whether a drop reflects a real developing problem or a temporary condition like a product changeover or unusual but legitimate operating mode before committing resources to an inspection.
Can iFactory build an equipment health dashboard using our existing sensors and PdM tools?
Yes — iFactory's platform is designed to connect with existing vibration, temperature, and current monitoring infrastructure along with common predictive maintenance tools, consolidating that data into a unified health score view rather than requiring a full sensor replacement. An initial assessment typically reviews what sensor coverage already exists across your critical assets and identifies where supplemental instrumentation would add the most value. To see a health score dashboard built around your existing equipment and sensor data,
book a demo with our team.
See Equipment Decline Before It Becomes a Failure
Vibration, temperature, current, and PdM alerts each tell part of the story — a unified health score across every critical asset is what turns those separate signals into an early warning your team can actually act on. iFactory builds it from the sensors you already have.