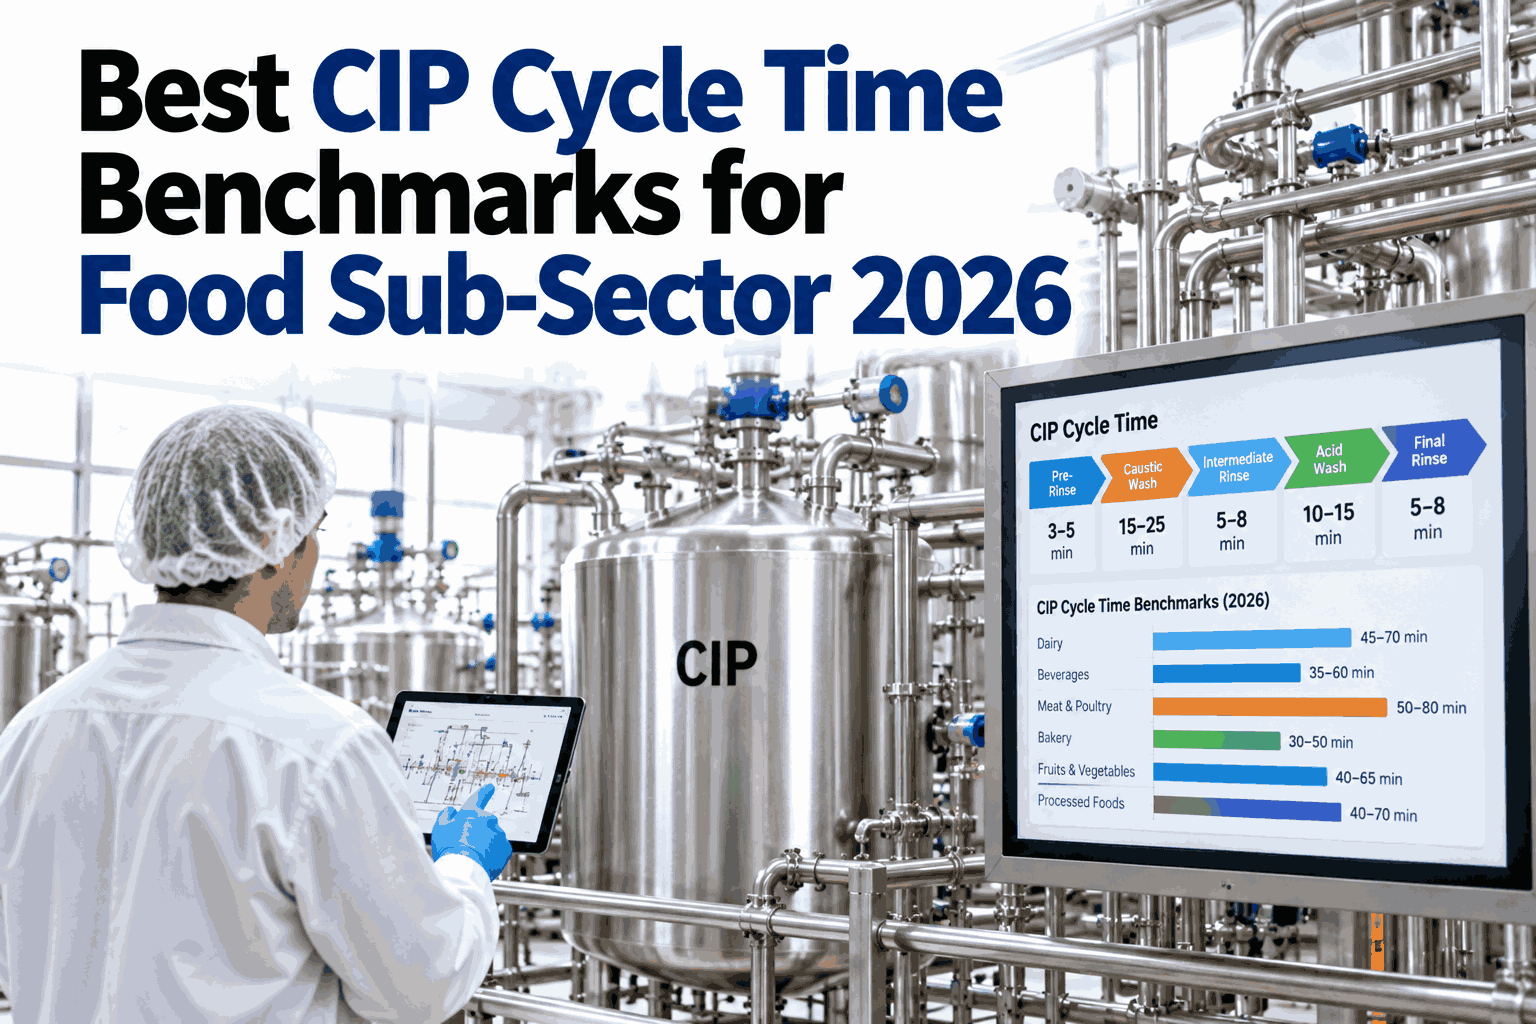
Clean-in-place cycles are built for safety first, so food plants rarely question how long a wash actually takes until the production schedule starts bending around it. A dairy line that could restart in ninety minutes but takes two hours loses the same thirty minutes every single day, stacking into one of the largest sources of planned downtime on the sanitation calendar. Comparing your own cycle times against what similar food sub-sectors are achieving in 2026 is often the fastest way to find out whether a slow cycle is a design limit or a habit. For benchmarks mapped to your own product and line, you can compare your CIP cycle against sub-sector data with our team.
See How Your CIP Cycle Time Compares Across Food Sub-Sectors
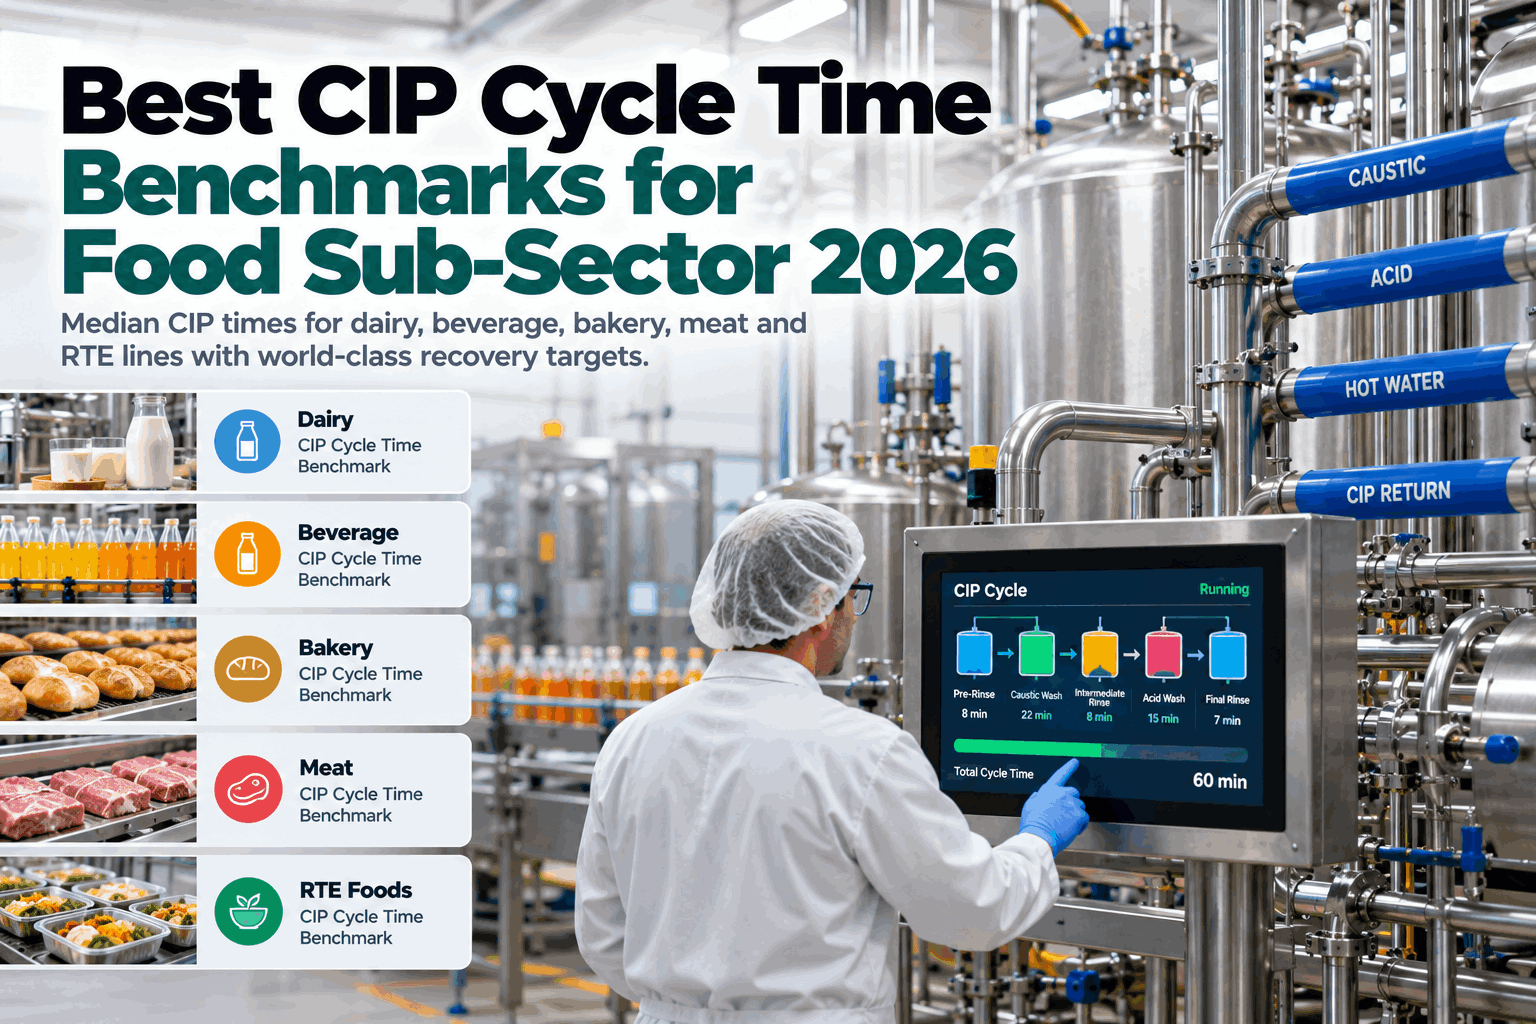
Median and world-class CIP cycle times for dairy, beverage, bakery, meat and RTE lines, so you know whether your wash time is competitive or costing you a shift every week.
Why CIP Time Became a Metric Plants Actually Track in 2026
For years, CIP was treated as a fixed cost of doing business safely. That has shifted as plants started comparing cycle time the same way they compare changeover time or OEE, and found real gaps between similar lines running the same product.
Median and World-Class CIP Cycle Times by Food Sub-Sector
These figures are indicative 2026 planning ranges drawn from typical published sanitation benchmarks and should be confirmed against your own product, soil load and regulatory requirements before being used as a target.
| Sub-sector | Typical median cycle | World-class target | Recovery potential |
|---|---|---|---|
| Dairy (pasteurized and UHT lines) | 100 to 120 min | 70 to 85 min | Up to 35 minutes per cycle |
| Beverage (bottling and filling) | 65 to 85 min | 45 to 55 min | Up to 25 minutes per cycle |
| Bakery (mixing and depositing lines) | 55 to 75 min | 35 to 45 min | Up to 20 minutes per cycle |
| Meat and poultry (processing lines) | 120 to 150 min | 90 to 105 min | Up to 40 minutes per cycle |
| RTE and prepared foods | 85 to 105 min | 60 to 70 min | Up to 30 minutes per cycle |
Ranges are wide because equipment design, soil type and validated kill-step requirements vary even within the same sub-sector, so these numbers work best as a starting comparison, not a strict pass or fail line.
Compare Your Own Cycle Against These Ranges
Share your product type, line design and current cycle time, and we will show where you sit against the 2026 sub-sector benchmarks.
Where the Minutes Go Inside a Typical CIP Cycle
Most CIP cycles follow the same broad sequence, though the time spent in each phase is where the real difference between a slow line and a fast one usually hides.
Caustic wash and the rinse steps around it often account for more than half the total cycle, which is why world-class lines focus recovery effort there first rather than trimming the shorter phases.
Which Sub-Sectors Have the Most Recovery Potential
Recovery potential is the gap between a typical median cycle and the world-class target, shown here as a share of the median. The wider the bar, the more time is realistically on the table.
Meat and poultry lines tend to carry the widest gap because of heavier soil load and stricter kill-step validation, while bakery lines usually start closer to their achievable target already.
What World-Class Lines Do Differently
The gap between a median cycle and a world-class one is rarely one big change. It is usually a handful of smaller adjustments applied consistently, shift after shift.
How to Benchmark Your Own Line in a Week
A credible internal benchmark does not need months of data collection. A single clean week of records is usually enough to see where a line actually sits.
What Plants Ask Before Acting on a CIP Benchmark
Get a CIP Cycle Time Benchmark for Your Own Lines
Book a session with iFactory AI to compare your cycle times against 2026 sub-sector data and find out how many minutes are realistically recoverable.