Refrigeration is usually the single largest energy line item in a cold storage operation, and most of that spend is invisible waste — a compressor cycling harder than it needs to, a defrost schedule set once years ago and never revisited, a dock door propped open during a long unload. None of it shows up as a single alarming spike; it shows up as a utility bill that creeps upward every year while nobody can point to why. iFactory tracks refrigeration performance continuously and turns scattered inefficiencies into a prioritized list of fixes, with the full breakdown at iFactory support.
Refrigeration Analytics · Cold Chain Energy
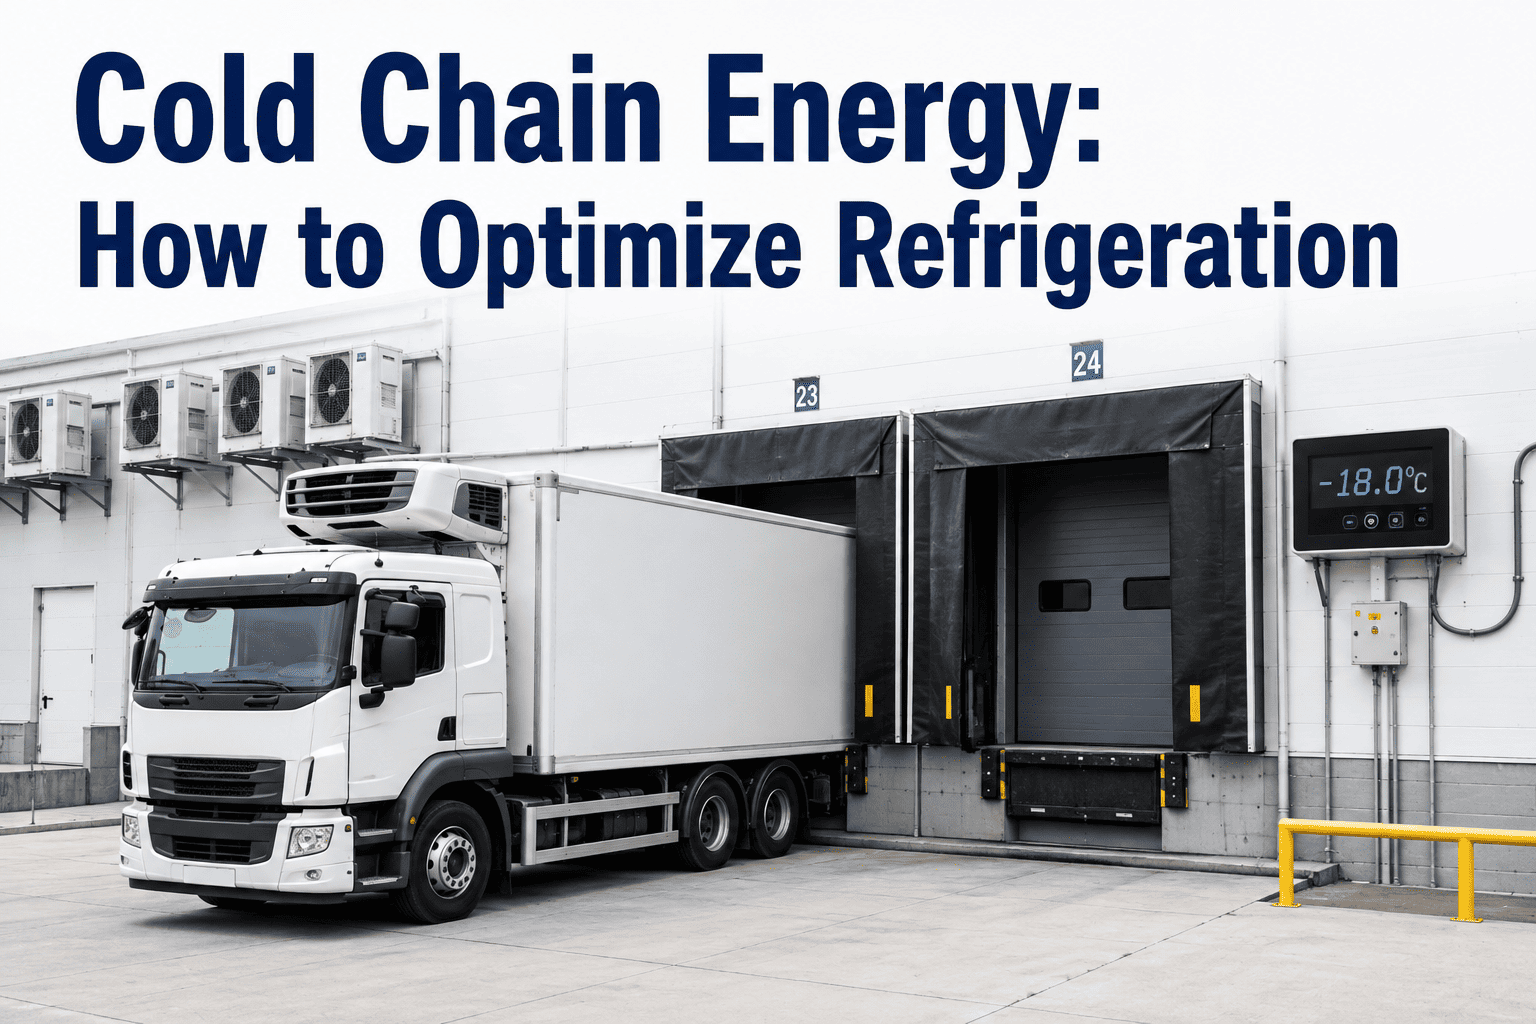
Cold Chain Energy: The Cost You're Paying Without Noticing It Grow
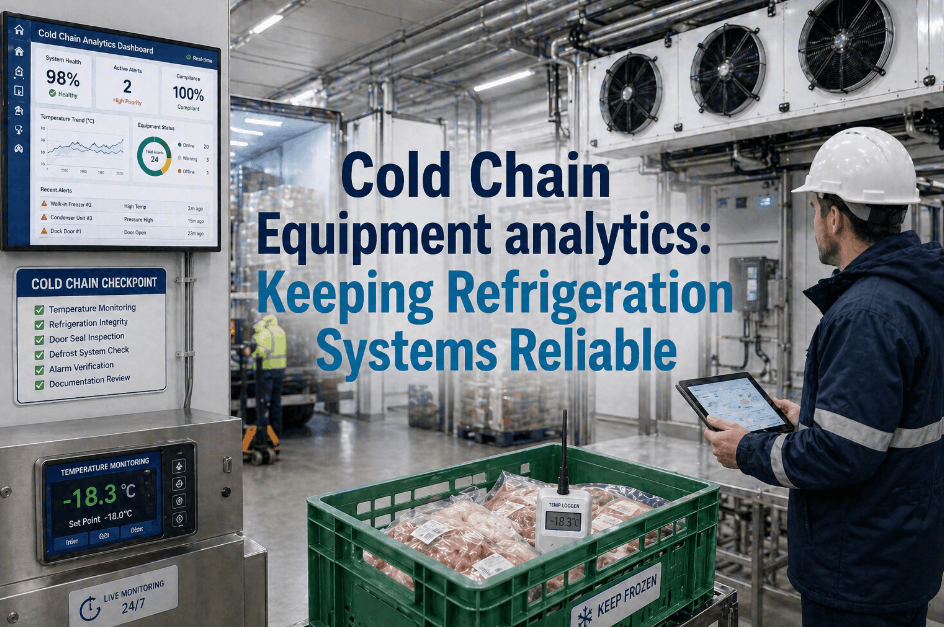
iFactory monitors compressor cycling, defrost timing, door activity, and lighting load across cold storage facilities to find the specific fixes that cut refrigeration spend without touching product safety.
Where the Energy Actually Goes
Refrigeration Load Breakdown in a Typical Cold Storage Facility
Door Openings / Infiltration
Four Levers Worth Pulling First
Where Optimization Efforts Pay Back Fastest
Compressor Efficiency
Tracking suction and discharge pressure trends reveals compressors working harder than the load requires, often due to a slowly fouling condenser.
Defrost Scheduling
Time-based defrost schedules set years ago often run more cycles than current frost accumulation actually needs, wasting energy on every unnecessary cycle.
Door Management
Dock doors left open during long unloads let warm, humid air flood a cold room, forcing the compressor to work overtime to recover setpoint.
LED Lighting Load
Legacy lighting in cold storage adds both direct energy cost and indirect heat load that the refrigeration system then has to remove.
You Can't Optimize What You're Not Measuring at the Component Level
iFactory breaks refrigeration energy use down by compressor, defrost cycle, and door activity so the savings opportunities are specific, not generic.
Typical Return by Optimization Area
Where Facilities See the Fastest Payback
Optimization Area
Typical Energy Reduction
Typical Payback Window
Defrost Rescheduling
8–14%
Under 3 months
Door Discipline & Sealing
5–10%
1–4 months
Condenser Cleaning Program
6–12%
Under 2 months
LED Retrofit
3–6%
6–18 months
Field Case
Cutting Defrost Energy Without Touching Product Temperature
A regional cold storage operator running a fixed six-cycle daily defrost schedule across its main freezer had never revisited the setting since installation eight years earlier. Continuous frost accumulation monitoring showed that actual buildup only justified four cycles per day during most of the year, with the extra cycles adding heat load the compressors then had to remove immediately afterward. Switching to demand-based defrost scheduling cut defrost-related energy use by roughly a third without any change in product temperature stability.
33%Defrost energy reduction
0Product temperature incidents
8 yrsSince schedule was last reviewed
Beyond the Utility Bill
Refrigeration Efficiency Increasingly Ties Into Sustainability Reporting
Refrigeration energy use doesn't stay contained to a facilities budget line anymore. Many food and beverage companies now report Scope 1 and Scope 2 emissions publicly, whether driven by investor pressure, retailer sustainability scorecards, or voluntary climate commitments, and refrigeration is consistently one of the largest single contributors to a cold storage-heavy operation's energy footprint. Compressor efficiency improvements, defrost optimization, and reduced infiltration losses translate directly into a measurable emissions reduction that sustainability teams can point to in annual reporting, not just a line item on an operations dashboard. Facilities that treat energy monitoring data as dual-purpose — feeding both cost reduction efforts and sustainability disclosures — get more organizational value out of the same underlying dataset than treating the two as separate initiatives run by different teams.
Preventive Maintenance Connection
Energy Drift Is Often the First Sign of a Mechanical Problem
Rising Compressor Amp Draw
A gradual increase in amp draw for the same cooling output often signals refrigerant charge issues or a failing component well before a hard failure occurs.
Extended Run Times
Compressors running longer than their historical baseline to hold the same setpoint frequently point to a fouled condenser, low refrigerant, or a door seal issue.
Irregular Defrost Recovery
Slower-than-normal temperature recovery after a defrost cycle can indicate evaporator coil icing beyond what the current defrost schedule accounts for.
Elevated Suction Pressure
Suction pressure trending outside normal range over several weeks is a leading indicator maintenance teams can act on before a full system failure.
Frequently Asked Questions
Refrigeration Optimization — Common Questions
Will optimizing refrigeration risk product temperature stability?
No — the approach is built around finding waste, not cutting cooling capacity below what product safety requires. Continuous monitoring means any adjustment to defrost timing, setpoints, or compressor staging is validated against actual temperature data before and after the change, so safety margins stay intact throughout.
Book a Demo to see how changes are validated for your facility.
How is this different from a one-time energy audit?
A one-time audit gives a snapshot, but refrigeration performance drifts continuously as condensers foul, seals age, and usage patterns shift. Continuous monitoring catches that drift as it happens rather than waiting for the next scheduled audit, which often means months of accumulated waste before a fix is identified.
Do we need new sensors on our compressors?
Many facilities already have compressor controllers capable of exporting the pressure and cycling data needed for analysis, in which case integration is largely a software connection. Facilities without that instrumentation typically add lightweight sensors during onboarding.
Contact support to review what your current refrigeration controls already provide.
How quickly do savings typically show up?
Door management and defrost rescheduling changes often show measurable savings within the first billing cycle after implementation, since they don't require capital investment. Condenser cleaning programs and LED retrofits take longer to show full payback but still typically register within the ranges shown above.
What size facility is this suited for?
The approach scales from single cold rooms to multi-building distribution centers, with monitoring depth adjusted to the number of compressors, doors, and zones involved. Larger facilities typically see proportionally larger absolute savings given the scale of refrigeration load involved.
Book a Demo for a facility-specific estimate.
Find Out Exactly Where Your Refrigeration Energy Spend Is Actually Going
Continuous compressor, defrost, and door monitoring with prioritized savings recommendations, live in as little as three weeks.