Ask five people at a food plant what an hour of downtime costs and you will usually get five different numbers, and none of them will agree with what finance uses when a capital request lands on their desk. The gap is not carelessness — it is that maintenance counts idle labor, operations counts lost cases, and finance counts contribution margin, and nobody reconciled the three before the number went into a slide. This page lays out downtime cost per hour benchmarks in food plants by sub-sector, line class, and product type, along with the assumptions finance teams actually accept when a business case is built on them, and how iFactory's support team helps plants replace a guessed number with a defensible one.
Downtime Economics · Food & Beverage
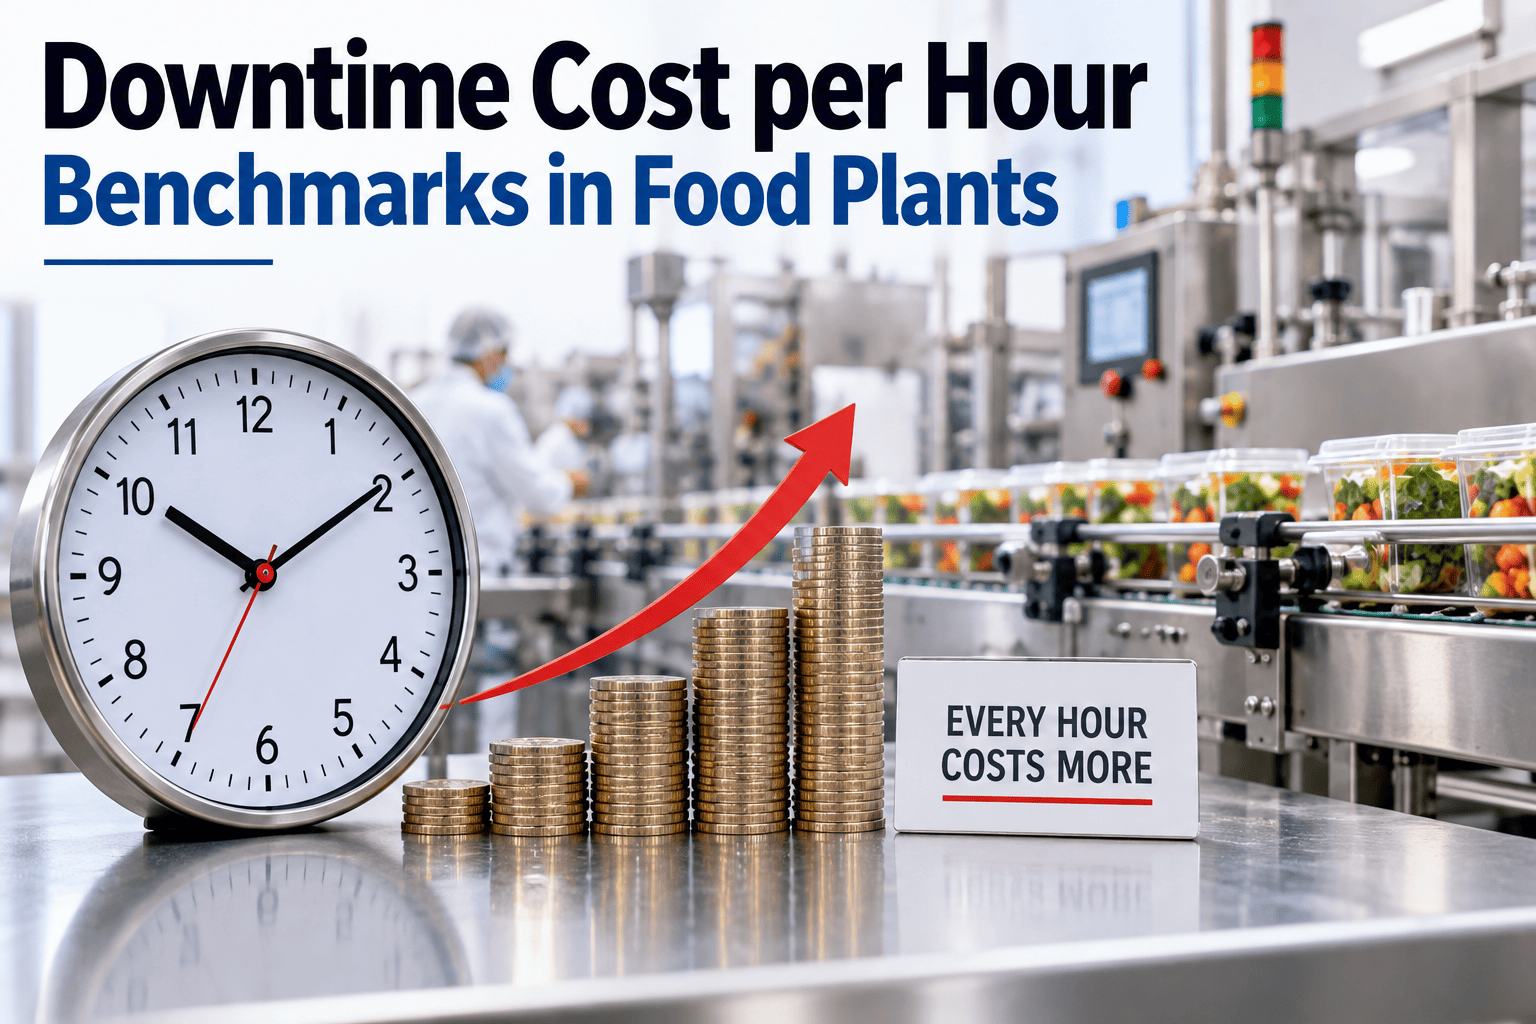
Downtime Cost per Hour Benchmarks in Food Plants
A working set of ranges by sub-sector, line class, and product value tier, plus the exact assumptions finance signs off on before a downtime-reduction project gets capital.
$400–$4,000
Per-hour range across sub-sectors
6 Inputs
Feed a defensible cost model
3 Tiers
Sub-sector, line class, product value
Why One Benchmark Number Fails
A Single Plant-Wide Figure Hides More Than It Reveals
A plant that quotes "$1,800 an hour" for every line is almost certainly wrong for most of its own lines. Downtime cost swings with what the line makes, how full the order book is that week, and whether the stoppage lands on a bottleneck or a line with slack capacity downstream.
01
Product Mix Changes Weekly
A bottling line running private-label water and the same line running a premium flavored SKU two days later carry very different lost-margin figures for the same hour of downtime.
02
Bottleneck vs Slack Capacity
An hour lost on the line that sets the plant's ceiling output costs far more than the same hour lost on a line running below its demonstrated capacity that week.
03
Demand Position Shifts Impact
Downtime during a sold-out week destroys margin that cannot be recovered; the same downtime during a soft-demand week may only shift production timing.
04
Recovery Time Is Often Uncounted
The stoppage itself is only part of the loss — ramp-up, changeover-style startup checks, and scrap generated while a line stabilizes often add 15 to 30 percent more lost time than the logged event.
Benchmark by Sub-Sector
Downtime Cost Ranges Across Food & Beverage Categories
These ranges reflect fully burdened cost per hour of unplanned stoppage, combining lost contribution margin, idle labor, and typical material loss for a mid-size facility running standard shift patterns.
Sub-Sector
Typical Range / Hour
Primary Cost Driver
Beverage Bottling & Canning
$1,200 – $3,500
High line speed means lost throughput compounds fast
Meat & Poultry Processing
$1,000 – $2,800
Perishable raw material loss during extended stops
Dairy Processing
$800 – $2,200
Product hold and rework cost during clean-in-place cycles
Bakery & Baked Snacks
$600 – $1,500
Batch loss when proofing or oven timing is interrupted
Confectionery & Dry Snacks
$500 – $1,300
Lower moisture risk but high packaging line speed loss
Ranges assume a mid-size facility; larger continuous-run plants with higher line speeds sit toward the upper bound, and lower-volume specialty plants sit toward the lower bound.
Benchmark by Line Class
Not Every Line in the Plant Costs the Same to Stop
Sub-sector sets the outer range, but line class inside the plant narrows it considerably. A primary processing line and a palletizing line in the same facility rarely share a cost profile.
Highest Cost
Filling & Packaging Lines
$900 – $2,500 / hr
Usually the plant's speed-limiting step; a stoppage here idles both upstream processing and downstream case handling simultaneously.
Mid Cost
Primary Processing Lines
$700 – $2,000 / hr
Cost is driven by raw material hold risk and batch integrity rather than pure speed, especially for temperature-sensitive product.
Lower Cost
Palletizing & Warehouse Handling
$300 – $900 / hr
Buffer inventory ahead of shipping typically absorbs short stoppages here without touching plant-wide throughput.
A Benchmark Range Tells You Where You Might Stand. It Does Not Tell You What Your Own Line Actually Cost Last Tuesday.
Continuous downtime cost tracking turns a published range into a number specific to your product mix, your shift, and your bottleneck.
Benchmark by Product Value Tier
Product Value Moves the Number More Than Line Speed Does
Two lines running at the same speed can carry very different downtime costs if one makes a commodity item and the other makes a premium, higher-margin product.
Premium / Ready-to-Eat
$1,500 – $4,000 / hr
High contribution margin per case means even short stoppages carry a heavy revenue-equivalent cost.
Private Label / Branded Mid-Tier
$700 – $1,800 / hr
Moderate margin with contractual fill-rate penalties that can add cost beyond the lost production itself.
Commodity / Bulk
$400 – $1,000 / hr
Lower per-unit margin, though high line speed on bulk lines can still generate meaningful volume loss quickly.
What Actually Builds the Number
Six Cost Components Behind Every Downtime Hour
40–55%
Lost Contribution Margin
Cases or units not produced during the stoppage, valued at margin rather than full sale price.
15–20%
Idle Labor Cost
Fully burdened wages for operators and line staff who remain paid but non-productive during the stop.
10–18%
Material & Ingredient Waste
Product held past shelf-stable windows, purged batches, or partially processed material scrapped at restart.
8–15%
Recovery Ramp Loss
Reduced-speed running and quality checks after restart before the line returns to rated output.
5–10%
Quality & Rework Cost
Additional inspection, hold-and-release testing, or rework triggered by an interrupted process step.
3–8%
Energy & Utility Waste
Steam, refrigeration, and compressed air continuing to run at cost during a non-productive stoppage.
The Finance Reconciliation
Five Assumptions Finance Teams Actually Accept
A downtime cost figure survives a capital review when the assumptions behind it are stated plainly rather than buried in a footnote. These five hold up across most food plant finance reviews.
1
Margin, Not Revenue
Lost production is valued at contribution margin per case, never at sale price, since fixed costs are not actually avoided during a stoppage.
2
Planned vs Unplanned Separation
Scheduled changeovers and sanitation windows are excluded entirely; the benchmark applies only to unplanned stoppages outside the production plan.
3
Fully Burdened Labor Rate
Idle labor cost uses the fully burdened hourly rate, including benefits and overhead allocation, not the base wage alone.
4
Bottleneck-Adjusted Throughput
The model reflects whether the stopped line was the plant's constraint that shift, rather than assuming every line's downtime caps total plant output equally.
5
Recovery Time Included
Ramp-up minutes after restart are added to the logged stoppage duration, since output stays below rated speed until the line stabilizes.
Building Your Own Number
From Published Range to Plant-Specific Figure
Step 01
Map Lines to Bottleneck Status
Identify which line sets plant output ceiling in a typical week and which lines carry slack capacity, since this changes the cost multiplier applied to each.
Step 02
Pull Actual Margin by SKU
Replace an average plant margin figure with SKU-level contribution margin so product mix on the day of a stoppage drives the calculation.
Step 03
Log Recovery Time Separately
Track ramp-up duration as its own event type so it is counted in total cost without inflating the reported stoppage duration itself.
Step 04
Automate the Cost Calculation
Connect downtime event logs directly to SKU margin and labor rate data so every stoppage generates a cost figure automatically rather than through a monthly spreadsheet exercise.
Field Example
When the Plant-Wide Average Understated the Real Number by Half
A multi-line beverage plant had used a single downtime cost figure of $1,400 per hour across its entire facility for several years, applied uniformly in every capital justification regardless of which line was affected. The number came from an old cost study and had never been revisited by line or by product mix.
When the finance and operations teams rebuilt the figure by line class and SKU margin, the flagship bottling line running premium flavored product came in closer to $3,100 per hour during peak season weeks, more than double the plant-wide average that had been used to prioritize reliability investment.
Reliability spending had been allocated evenly across lines under the old average. Once the true per-line figures were in place, investment shifted toward the flagship line's changeover and recovery time, and a capital request that had previously been rejected for lacking a strong enough payback case was approved within the same quarter.
2.2x
Real cost vs old plant-wide average
1 Quarter
From revised figure to approved capital
Frequently Asked Questions
What Finance and Operations Teams Ask First
Should downtime cost be based on revenue or contribution margin?
Contribution margin is the figure finance teams accept, since revenue overstates the true loss by including fixed overhead that keeps accruing whether the line runs or not. Using margin keeps the benchmark defensible when a capital request is reviewed line by line. Most rejected downtime business cases share this exact flaw, valuing lost cases at sale price instead. Teams that want this margin model built once and reused across every line can
book a demo to see it mapped to their own SKUs.
Do these benchmarks apply the same way to a small plant as a large one?
Directionally yes, but the dollar figures shift with scale — smaller facilities with lower line speed typically sit toward the lower end of each range, while high-speed plants sit toward the upper end. Product mix and margin per case matter more than plant size alone in most cases. A small specialty line running a premium product can carry a higher per-hour cost than a larger commodity plant.
Book a demo to get a figure calibrated to your own facility rather than an industry average.
How often should a plant recalculate its downtime cost figure?
A quarterly review is reasonable for most plants, since product mix, ingredient costs, and labor rates shift meaningfully over that period. Plants with frequent SKU changes or seasonal demand swings benefit from a rolling calculation instead of a fixed quarterly number. Continuous tracking through
iFactory support keeps the figure current automatically.
Book a demo to see how that update cycle works.
Does recovery ramp time really add meaningfully to the total cost?
Yes — a line running at reduced speed for twenty minutes after restart, plus any quality hold checks on the first product through, can add fifteen to thirty percent to the total cost of a logged stoppage. Excluding it is the most common reason a downtime figure comes in lower than what finance later reconciles against actual output. Plants that log ramp-up as its own tagged event consistently produce numbers that hold up under scrutiny.
Book a demo to see how ramp-up gets captured automatically.
What is the fastest way to get a plant-specific number instead of relying on published ranges?
Connecting existing downtime logs to SKU-level margin and labor rate data is the fastest path, since most plants already capture stoppage duration and reason codes but never link them to financial data automatically. A short working session is usually enough to map what data already exists and what needs to be added.
Book a demo to see it built live against a sample of your own line data, or reach out through
iFactory support with setup questions first.
Stop Defending a Downtime Number Nobody Fully Trusts.
Build a cost-per-hour figure by line, by SKU, and by shift that finance signs off on the first time it is presented.