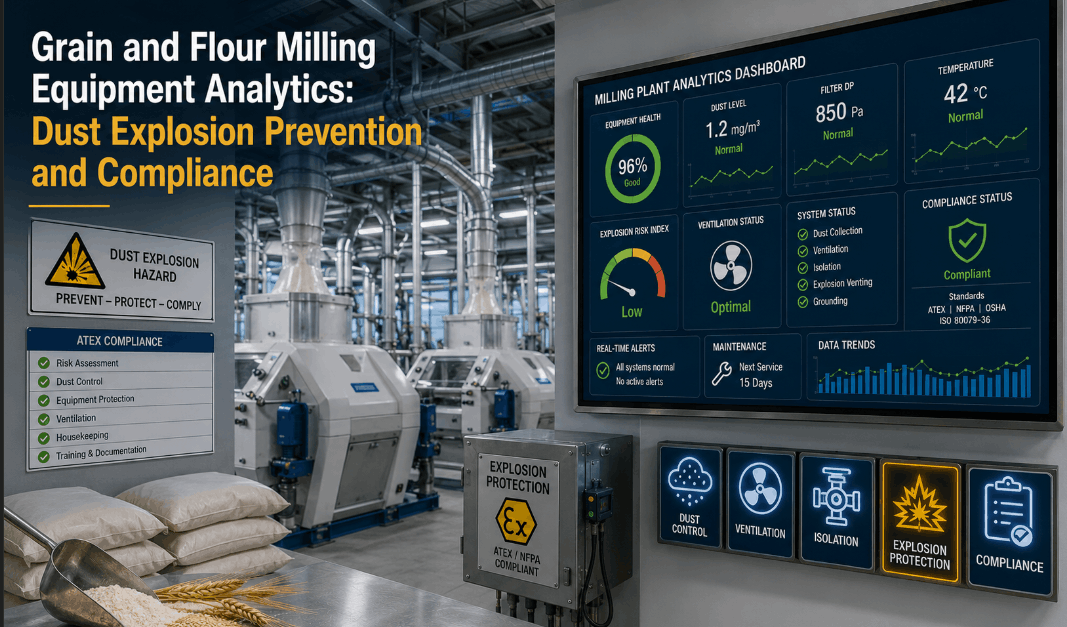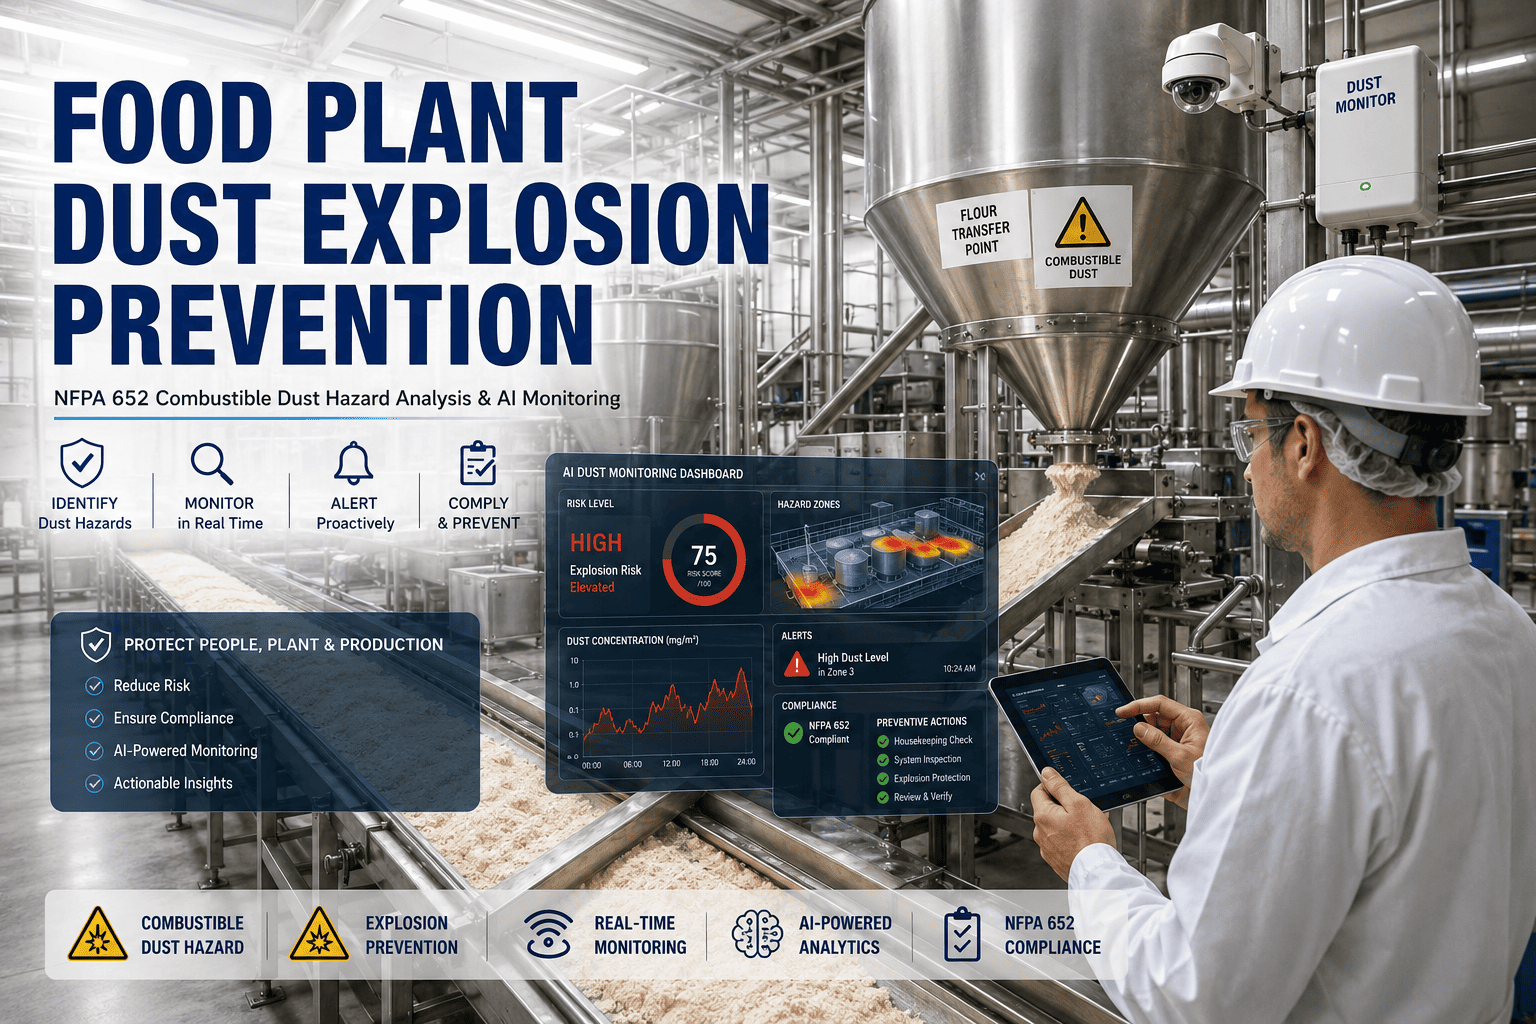
A grain elevator explosion or a bakery mixing room flash fire rarely starts with something dramatic. It starts with a thin layer of flour or starch dust sitting on a beam overhead, undisturbed for weeks, until a spark from a bearing or a static discharge turns it into a primary explosion, which then throws up every other layer of dust in the room and turns a small fire into a secondary blast that takes out walls. NFPA 652 exists precisely because that sequence is predictable and preventable, and iFactory's AI dust monitoring gives EHS teams the continuous visibility that a quarterly housekeeping walk-through cannot, something worth seeing directly in a demo.
Most Food Plants Can Name Their Dust Hazard Areas. Few Can Tell You the Dust Layer Depth in Them Right Now
iFactory pairs your NFPA 652 Dust Hazard Analysis with continuous AI-driven dust concentration and accumulation monitoring, so housekeeping gaps get flagged the same shift they appear instead of at the next scheduled audit.
Combustible Dust Incidents Follow the Same Pattern Almost Every Time
Food-grade powders such as flour, sugar, starch, and milk powder are combustible in the right particle size and concentration, and federal incident investigations of past dust explosions repeatedly cite the same root cause: an accumulated layer of dust above what routine housekeeping caught, ignited by an everyday source like friction, static, or overheated bearings. NFPA 652 requires every facility handling combustible particulate to complete a Dust Hazard Analysis identifying where those layers can build and how thick is too thick.
Industry guidance treats a dust layer roughly 1/32 inch thick, about the thickness of a paperclip, spread across a five percent floor area as a threshold worth a documented DHA finding.
A Dust Hazard Analysis Is a Sequence, and Each Step Feeds the Next
NFPA 652 does not ask for a one-time inspection. It asks for a structured analysis that identifies hazard locations, evaluates their severity, and assigns mitigation, then requires the whole cycle to repeat on a defined interval.
Identify Dust-Generating Processes
Map every point where combustible particulate is created, conveyed, or can settle, from mixers and sifters to overhead ledges and duct interiors.
Test Material Explosibility
Send representative samples for Kst and Pmax testing to establish how violently your specific product ignites and burns compared to generic dust tables.
Evaluate Existing Controls
Score current housekeeping frequency, dust collection design, and ignition source controls against the explosibility data from step two.
Assign and Track Mitigation
Document required upgrades such as explosion venting, isolation devices, or revised cleaning schedules, each with an owner and a due date.
Reassess on a Fixed Interval
Repeat the analysis whenever a process changes and at minimum on the interval your AHJ or insurer requires, typically every five years.
Four Things iFactory Monitors Continuously So Your DHA Findings Don't Go Stale
A Dust Hazard Analysis is a snapshot. Housekeeping conditions change daily. iFactory's monitoring layer sits between DHA cycles and tells you when a documented control has actually drifted.
Dust Accumulation Detection
Vision-based sensors flag layer buildup on ledges, beams, and equipment tops before it reaches the depth threshold your DHA identified as unsafe.
Airborne Concentration Trends
Tracks dust concentration readings across shifts to catch a collection system losing efficiency long before a filter alarm trips.
Housekeeping Task Verification
Confirms scheduled cleaning actually occurred in flagged zones, closing the gap between a paper checklist and the floor.
Hot Work and Ignition Proximity
Flags welding, grinding, or other hot work scheduled near an active dust zone so permits can be cross-checked against current conditions.
A DHA Document Tells You Where the Risk Is. It Cannot Tell You If It's Still Under Control Today
iFactory closes that gap with continuous monitoring tied directly to your documented hazard zones, so drift gets caught before it becomes an incident.
Typical Dust Hazard Zones and What iFactory Tracks in Each
Every plant's DHA produces a slightly different zone map, but most food facilities handling powders share a common set of high-risk areas worth comparing against your own findings.
| Zone | Typical Risk Driver | Primary Monitoring Signal | Review Interval |
|---|---|---|---|
| Mixer and Sifter Room | Fine particulate suspension | Airborne concentration | Continuous |
| Bucket Elevator Legs | Friction and static buildup | Ignition proximity | Continuous |
| Overhead Ledges and Beams | Settled layer accumulation | Accumulation depth | Continuous |
| Dust Collector Interior | Collection efficiency loss | Concentration trend | Continuous |
Results Plants Report After Adding Continuous Dust Monitoring to Their DHA Program
These figures reflect changes reported by food manufacturing sites after layering AI-based monitoring on top of an existing NFPA 652 compliance program.
Questions EHS Managers Ask About AI Dust Monitoring and NFPA 652
Your DHA Identified the Risk Zones. Make Sure They Stay Controlled Every Shift, Not Just at Reassessment
See how iFactory's continuous dust monitoring layers onto your existing NFPA 652 program in a live walkthrough.