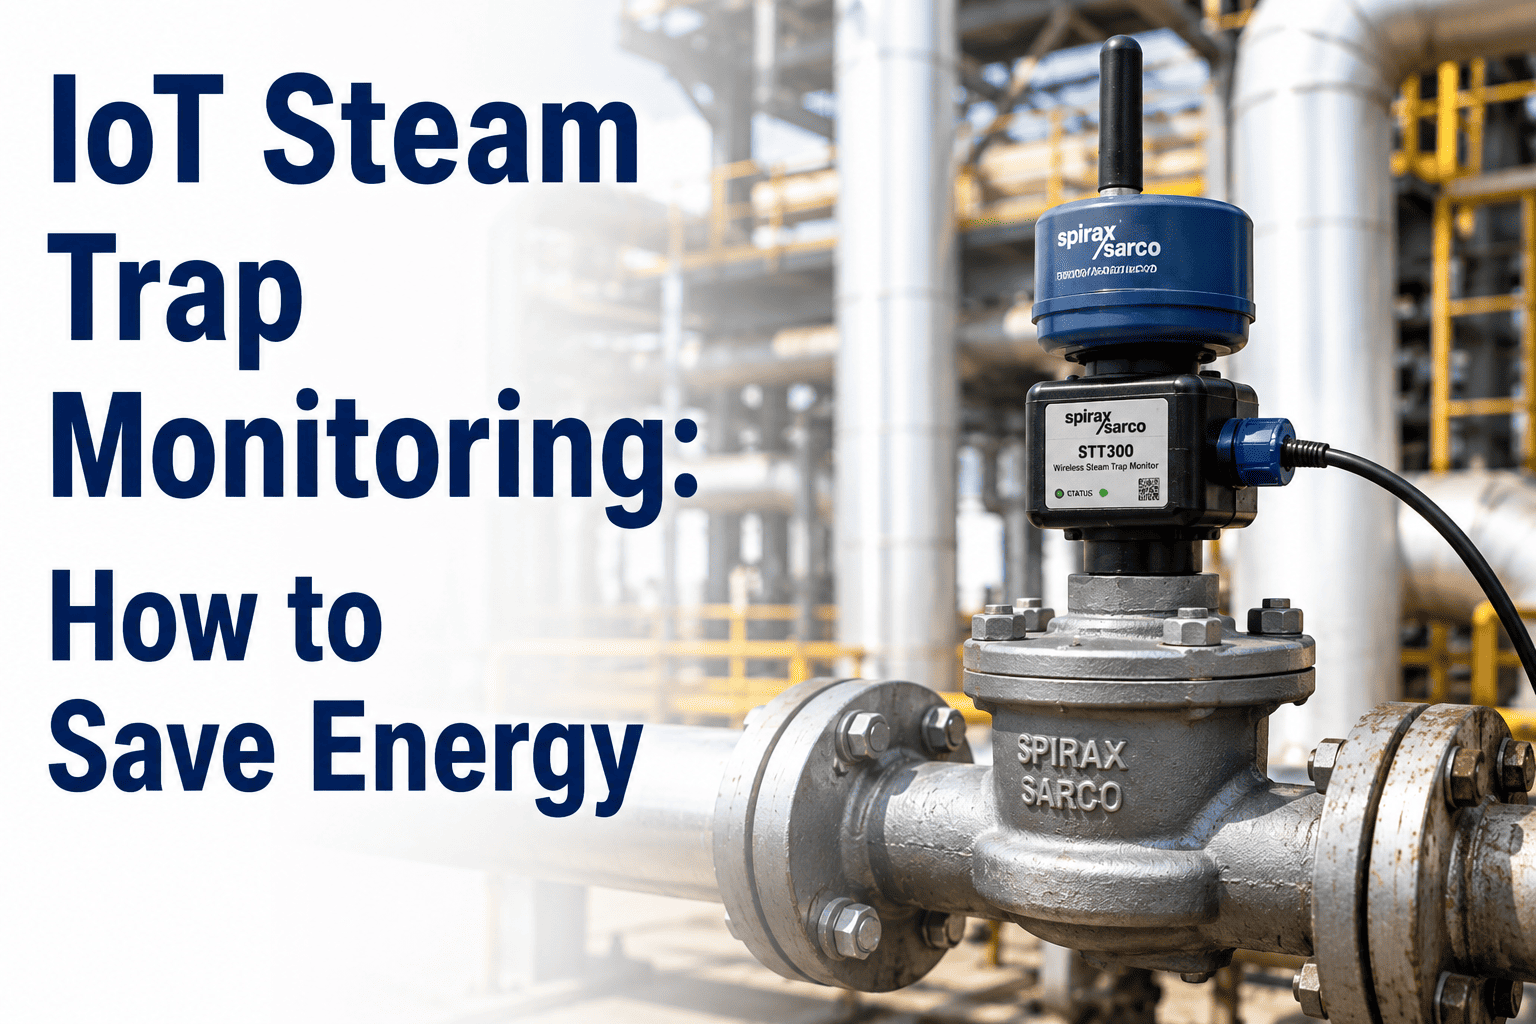
A single failed steam trap stuck open can waste enough steam in a year to run a mid-size boiler for weeks, and most food plants have dozens to hundreds of them scattered across a steam distribution system that nobody inspects more than once or twice annually. Failed traps don't announce themselves — they hiss quietly behind insulation, in a mezzanine, or above a suspended ceiling, wasting energy the whole time. iFactory monitors steam traps continuously across a food plant's full steam system, catching failures within days instead of months, with the complete approach at iFactory support.
IoT Steam System Monitoring · Food Plant Energy
IoT Steam Trap Monitoring: Find the Leaks Your Annual Survey Misses
iFactory tracks every steam trap across a food plant's distribution system continuously, flagging failures as they happen and quantifying the exact energy cost of each one.
How Traps Fail
Two Failure Modes, Both Costly in Different Ways
Failed Open
Live steam blows continuously through the trap instead of just condensate, wasting energy around the clock until someone notices or the trap is inspected.
Failed Closed
Condensate backs up in the line, reducing heat transfer efficiency in the connected equipment and risking water hammer damage over time.
The Scale of the Problem
What Unmonitored Steam Systems Typically Lose
15–30%
Of steam traps in a typical uninspected plant are failed at any given time
Once a year
Typical frequency of manual trap surveys in plants without continuous monitoring
Months
How long a failed-open trap commonly runs undetected between surveys
$1,000s
Annual energy cost of a single large trap failed open, depending on size and pressure
A Trap Survey Once a Year Means Months of Silent Waste Between Checks
Continuous acoustic and temperature monitoring on each trap flags failures within days, not at the next scheduled survey.
How Monitoring Works
From Sensor to Prioritized Repair List
1
Acoustic & Temperature Sensor Installed
2
Trap Signature Monitored Continuously
3
Failure Pattern Detected
5
Repair Prioritized by Cost Impact
Field Case
Finding 41 Failed Traps in the First Month of Monitoring
A dairy processing plant running an annual manual trap survey believed its 340-trap steam system was performing within normal parameters, since the last survey had flagged only a handful of failures. Continuous acoustic monitoring installed across the full trap population identified 41 traps already failed open within the first month, many showing failure signatures consistent with several months of undetected steam loss. Repairs were prioritized by estimated energy cost, with the ten highest-impact traps fixed within the first week, cutting steam system losses well before the next scheduled survey would have caught them.
41Failed traps found in month one
10Highest-impact traps repaired in week one
340Total traps under continuous monitoring
Getting Started
Five Steps to Deploy Continuous Trap Monitoring
1Inventory every trap in the system with its type, size, and connected pressure, since failure signatures vary by these factors.
2Prioritize sensor installation on the largest and highest-pressure traps first, where failure cost is greatest.
3Establish a baseline acoustic and temperature signature for each trap while operating normally.
4Route failure alerts to the maintenance team with an estimated energy cost attached, so repairs get prioritized correctly.
5Track condensate recovery alongside trap health, since the two are closely linked in overall steam system efficiency.
The Bigger Picture
Steam Trap Health Is Only Half the Efficiency Story
Condensate recovery and steam trap performance are tightly linked, and food plants that focus only on trap failures while ignoring condensate return rates typically leave a meaningful portion of potential savings on the table. Condensate carries substantial residual heat energy, and every gallon that isn't returned to the boiler feed system has to be replaced with cold makeup water that requires additional fuel to reheat from scratch. A plant with generally healthy traps but poor condensate return infrastructure — degraded insulation on return lines, undersized piping, or return pumps operating below capacity — can still be losing significant energy even without a single failed trap in the system. Continuous monitoring that tracks both trap health and condensate return volume together gives a more complete efficiency picture than trap monitoring alone, and often surfaces condensate infrastructure issues that a trap-only survey would never catch.
Prioritization Framework
How Maintenance Teams Should Rank Trap Repairs
By Steam Pressure
Higher-pressure traps waste substantially more energy per hour when failed open, making them the natural first priority even if the orifice size is similar to a lower-pressure trap elsewhere.
By Duration of Failure
A trap that has been failed for months has already cost more cumulatively than one that failed yesterday, which affects how urgently a repair should be scheduled versus batched with routine maintenance.
Frequently Asked Questions
Steam Trap Monitoring — Common Questions
How does acoustic monitoring tell the difference between normal operation and a failure?
Each trap type has a distinct acoustic and temperature signature when operating correctly, cycling between hot condensate discharge and a closed, cooler resting state. A failed-open trap produces a continuous rushing signature consistent with live steam passing through, while a failed-closed trap shows a temperature profile that never cycles. The monitoring system is calibrated to each trap's baseline during setup so deviations are flagged reliably.
Book a Demo to see signature detection for your trap types.
Do we need to monitor every trap in the plant, or just the large ones?
Most plants see the strongest return by starting with the largest and highest-pressure traps, since a single large trap failed open can waste more energy than dozens of small ones combined. Full-system coverage is common over time, but a phased rollout starting with high-impact traps typically delivers savings that fund expansion to the rest of the system.
How is energy loss actually quantified per trap?
Loss estimates combine the trap's orifice size, connected steam pressure, and estimated duration of failure to calculate steam mass loss, which is then converted to an energy and cost figure using your facility's fuel and boiler efficiency data. This lets maintenance teams prioritize repairs by dollar impact rather than guessing which traps matter most.
Contact support for a sample energy loss calculation.
What's the typical payback period for deploying this?
Given that 15 to 30 percent of traps in an unmonitored system are commonly failed at any time, most food plants recover the cost of continuous monitoring within the first several months through avoided steam waste alone, before accounting for reduced unplanned downtime from water hammer damage.
How long does installation take across a plant-wide trap population?
A phased rollout starting with the highest-impact traps typically goes live within two to three weeks for the first tier, with full plant-wide coverage completed over four to eight weeks depending on total trap count and accessibility.
Book a Demo for a rollout plan specific to your steam system.
Stop Waiting for the Next Annual Survey to Find Out How Much Steam You're Wasting
Continuous steam trap monitoring with prioritized repair recommendations, live in as little as two weeks.