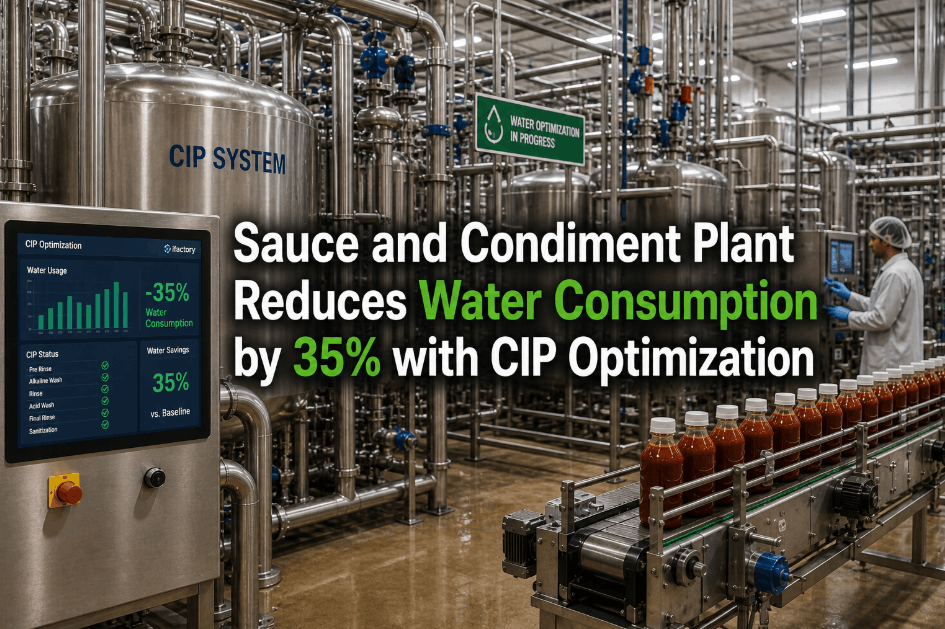
Water is one of the largest hidden operating costs in food manufacturing, and it is also one of the least measured. Most plants know their monthly water bill down to the dollar but have almost no idea which process, which line, or which shift is actually consuming that water. A slow leak in a CIP system or a valve left running overnight can add thousands of gallons to a monthly bill without tripping any alarm, because nobody is watching flow in real time. As sustainability targets and utility costs both climb, food manufacturers are turning to IoT flow sensors to finally answer the question their utility bill never could, and the results from teams who have made this shift are documented through real conservation program outcomes worth reviewing.
See Exactly Where Every Gallon Goes
iFactory water monitoring tracks consumption by line, process, and shift in real time, catching leaks and waste before they show up on next month's bill.
Why Most Plants Cannot Answer Where Their Water Goes
A single utility meter at the property line tells a plant its total consumption but nothing about the internal breakdown between cleaning, processing, cooling, and sanitation, which makes targeted reduction efforts nearly impossible without submetering.
Where to Place Submeters for Maximum Insight
Strategic submeter placement gives a plant the ability to isolate which specific process is driving consumption, rather than only seeing a facility-wide total.
What an Undetected Leak Actually Costs
Small leaks are easy to dismiss individually, but the cumulative cost of an undetected leak running continuously adds up faster than most facility managers expect.
Manual Utility Bill Review Versus Real-Time Monitoring
The difference between reviewing a monthly utility bill and watching real-time flow data is the difference between forensic accounting and active management.
| Capability | Monthly Bill Review | Real-Time IoT Monitoring |
|---|---|---|
| Leak Detection Speed | Weeks to a full billing cycle | Minutes to hours |
| Process-Level Attribution | Not possible with one meter | Full breakdown by line and process |
| Conservation Target Tracking | Retrospective only | Live progress against targets |
| Overnight Waste Visibility | Invisible in aggregate totals | Flagged automatically as anomaly |
Turn Your Water Bill Into a Management Tool, Not a Surprise
Get real-time visibility into water use by line and process, with automatic alerts the moment consumption drifts from baseline.
Water Data Increasingly Feeds Sustainability Commitments
Beyond cost savings, water consumption data has become a standard input for corporate sustainability reporting and retailer scorecards that food brands are increasingly expected to satisfy.
Frequently Asked Questions
How many submeters does a mid-size food plant typically need to get useful water data?
Most mid-size food plants get meaningful insight from somewhere between eight and twenty submeters placed at key process boundaries, including each major production line, the CIP system, cooling tower makeup, and boiler feed, rather than attempting to meter every individual valve in the facility. The goal of initial deployment is usually to isolate the largest consumption categories first, since a handful of well-placed meters at major process boundaries typically reveal 80 percent of the actionable insight, with additional granular metering added later once the biggest opportunities have already been addressed. Starting with a phased approach also keeps initial investment manageable while still delivering meaningful visibility quickly. Book a demo to get a submetering plan sized to your facility.
Can water monitoring data help reduce sewer discharge costs in addition to water intake costs?
Yes, and this is often an overlooked benefit since many food plants pay sewer discharge fees calculated as a percentage of metered water intake, meaning that every gallon of water saved on the intake side typically produces a proportional savings on the discharge side as well, effectively doubling the financial impact of conservation efforts. Some facilities also use flow data to identify opportunities for water reuse or recycling within the plant, such as reusing final rinse water from one cleaning cycle as the initial rinse for another, which further reduces both intake volume and discharge volume simultaneously. Contact support to model combined intake and discharge savings for your facility.
How quickly can a leak alert reach the maintenance team after abnormal flow is detected?
In a properly configured IoT monitoring system, an alert for abnormal flow, such as continuous consumption during hours when the plant should be idle, typically reaches the responsible maintenance contact within minutes of the anomaly being detected, compared to the days or weeks it often takes to notice the same issue through a monthly utility bill review. The exact detection speed depends on the alert threshold configuration and how the anomaly detection logic is tuned for your specific facility's normal usage patterns, since a threshold set too sensitively can generate false alarms while one set too loosely can delay genuine leak detection. Book a demo to see leak alert configuration and response times.
Do water flow sensors require special installation that would disrupt ongoing production?
Most modern flow sensors used for water submetering, particularly ultrasonic clamp-on style meters, can be installed on the outside of existing pipes without cutting into the line or requiring any production downtime, which has made retrofit submetering projects significantly more practical than they were with older insertion-style meters that required a hot tap or line shutdown. For applications requiring higher accuracy or lower flow ranges, an inline meter may still be preferred, which does require a brief installation window, but this is typically scheduled during planned maintenance downtime rather than disrupting active production. Contact support to review installation options with minimal production impact.
What kind of return on investment should a food plant expect from a water monitoring program?
Facilities that implement submetering and real-time monitoring commonly see total water and sewer cost reductions in the range of 10 to 20 percent within the first year, driven by a combination of leak detection, process optimization, and behavioral changes that come from teams finally being able to see consumption data broken down by line and shift. The payback period for the sensor hardware and platform investment is typically well under two years for facilities with meaningful water spend, and the ongoing value continues to compound as conservation becomes an active management practice rather than a once-a-year utility bill review. Book a demo to get an ROI estimate based on your current water spend.
Stop Letting Your Water Bill Be a Guessing Game
iFactory gives food plants real-time water visibility by line and process, turning conservation from an annual review into an everyday practice.