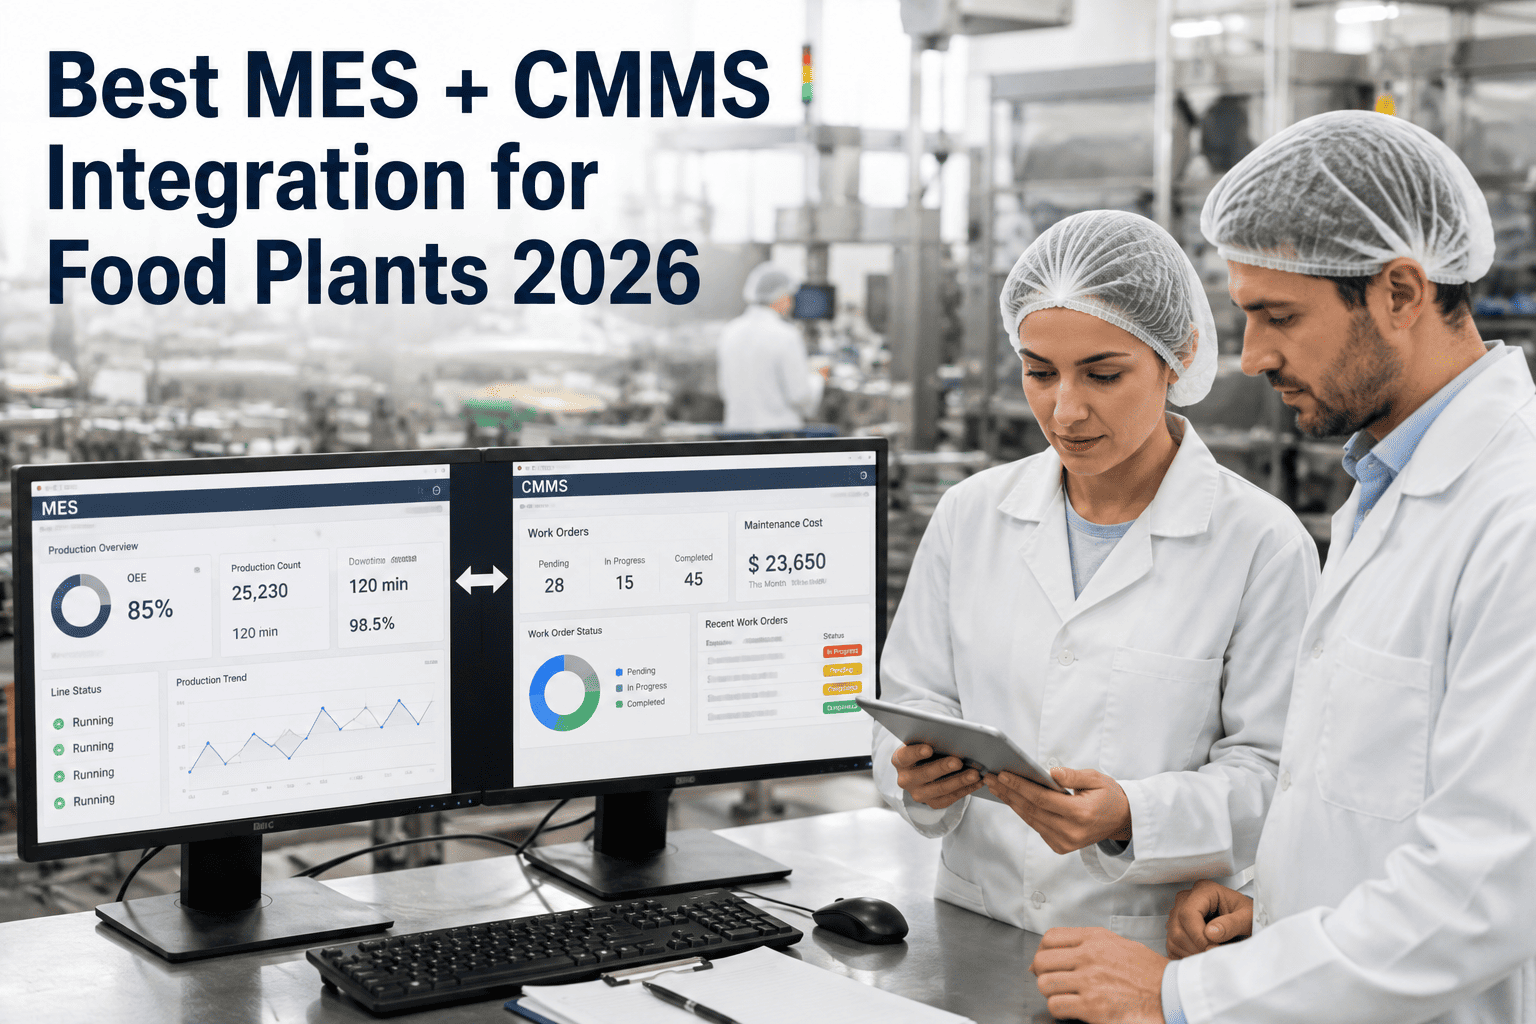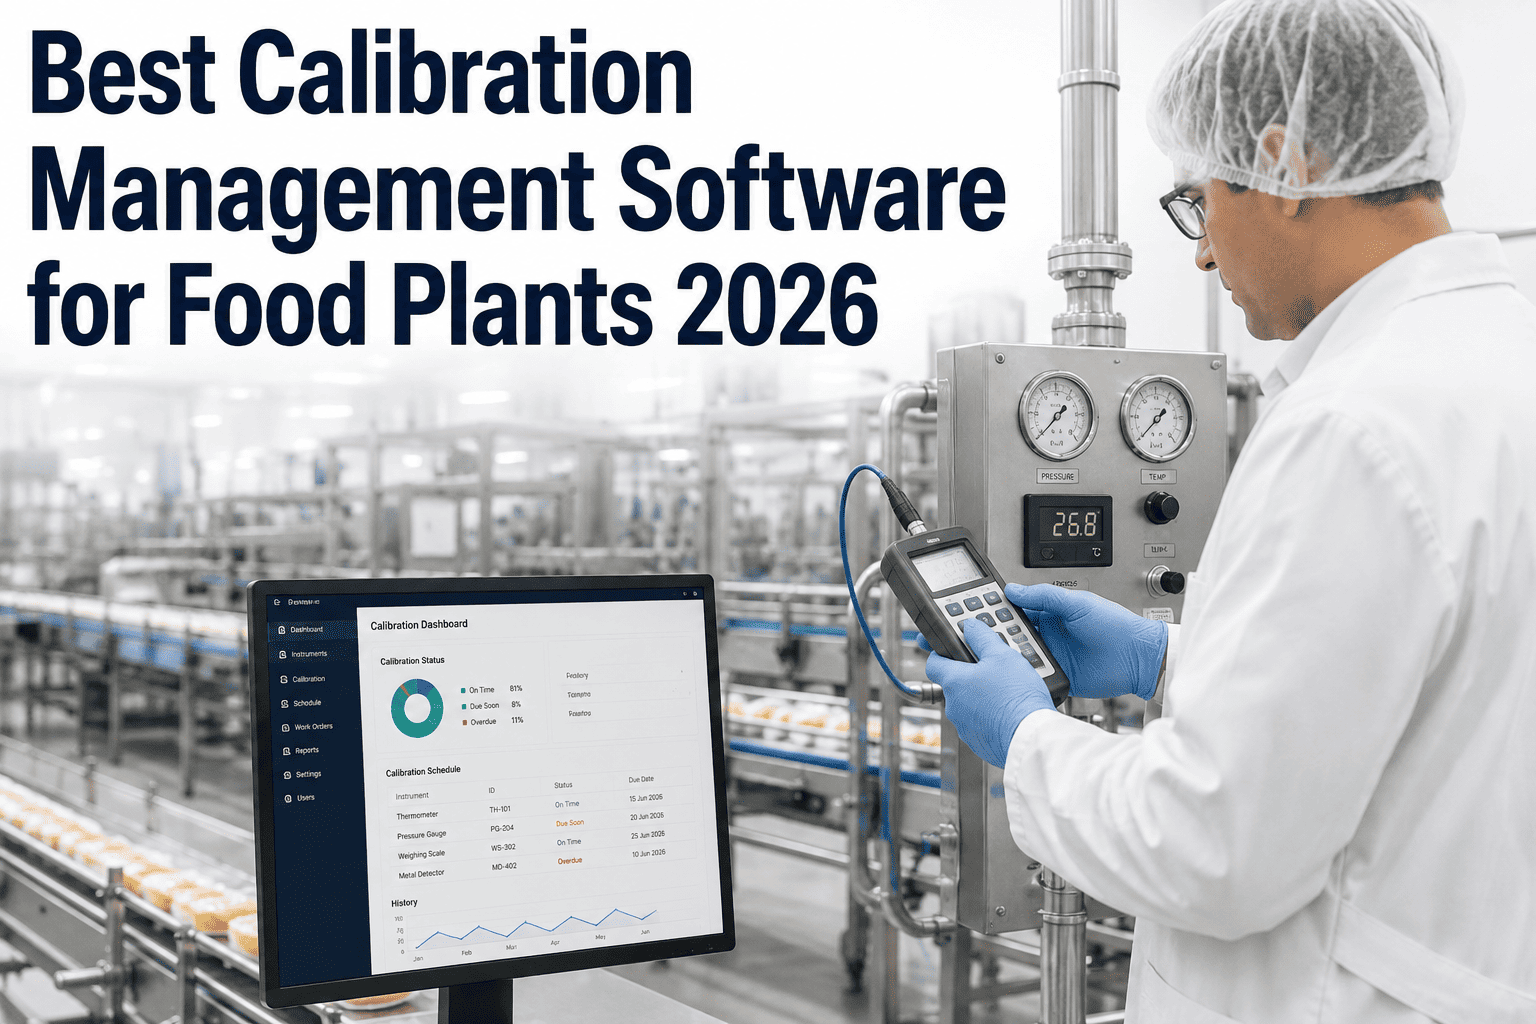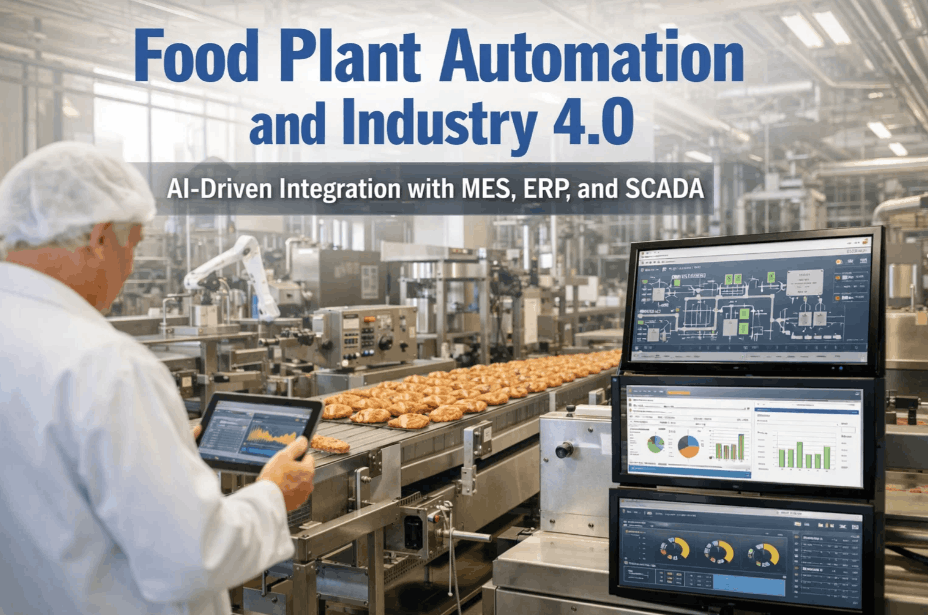
Most food and beverage plants already generate every signal needed to calculate OEE correctly. The problem is that availability lives in the SCADA historian, performance lives in the line PLC counters, and quality lives in the MES batch record — three systems with three clocks, three units of measure, and three owners who rarely reconcile. The result is an OEE number nobody trusts enough to act on. This page lays out the OPC-UA, MQTT, and REST integration patterns that unify those layers without replacing a single control system, and you can walk through the architecture against your own line list with our engineering team.
One trusted OEE number across SCADA, MES, and CMMS — built on the systems you already run
iFactory AI sits above your existing control layer as a normalization and analytics tier. Standard protocol adapters, deterministic OEE math, and lot-aware context for every batch, changeover, and CIP cycle.
Why food plants stall at OEE integration
Food manufacturing carries integration constraints that discrete assembly plants simply do not have. Lines run continuously through allergen changeovers, sanitation windows, and product family switches, and each of those events changes what "planned downtime" even means. When three systems disagree about the definition, the OEE number becomes a debating point instead of a decision tool.
- Machine run and stop states
- Motor loads, pressures, temperatures
- Alarm history with millisecond stamps
- Line speed and conveyor status
- Work order, SKU, and lot genealogy
- Planned versus actual batch quantity
- Hold, release, and rework status
- Labor and shift assignment
- Work order history per asset
- PM schedules and compliance
- Spare part consumption
- Mean time between failures
The five-layer integration model iFactory AI deploys in food plants
The architecture below is deliberately additive. Nothing is removed, no PLC logic is rewritten, and no MES schema is modified. iFactory reads from each layer, normalizes timestamps and units, and writes contextualized OEE back out to whichever system your teams already live in.
Field devices and instrumentation
Flow meters, checkweighers, metal detectors, X-ray inspection units, temperature probes, VFDs, and photo-eye counters. These are the source of truth for both throughput and reject counts, and in most plants they are already wired to a controller.
PLC and SCADA supervisory layer
Rockwell, Siemens, Schneider, and Mitsubishi controllers publishing through an OPC-UA server or a historian such as PI, Ignition, or Wonderware. iFactory subscribes to a curated tag list rather than polling the entire namespace, which keeps controller scan-time impact below measurable thresholds.
MES, ERP, and quality systems
Work orders, SKU master data, planned rates, lot genealogy, and disposition records arrive over REST or a staged database view. This is what turns a raw stop event into "line 3 lost 22 minutes during the yogurt-to-kefir changeover on lot 44118."
iFactory AI unified data and OEE engine
A single deterministic OEE calculation applied consistently across every line, with configurable planned-downtime rules for CIP, sanitation, and scheduled changeover. Loss events are auto-classified against a six-big-losses taxonomy and enriched with asset, shift, SKU, and operator context.
Consumption and action layer
Line-side andon displays, shift-handover reports, CMMS work-order triggers when degradation is detected, and role-based dashboards for supervisors, quality, and plant leadership. The same number appears everywhere because it is computed once.
Choosing between OPC-UA, MQTT Sparkplug B, and REST
There is no single correct transport for a food plant. Most sites end up with a hybrid: OPC-UA for controller data, MQTT for distributed or wireless assets, and REST for business-system context. The table below is the decision framework iFactory engineers apply during the discovery phase.
| Criterion | OPC-UA | MQTT Sparkplug B | REST / database view |
|---|---|---|---|
| Best suited to | PLC and SCADA tag data on a wired plant network | Distributed assets, remote utilities, wireless sensors, multi-site rollups | MES work orders, ERP SKU master, quality dispositions |
| Data model | Rich, self-describing address space with types and metadata | Topic namespace with birth certificates defining payload structure | Whatever the vendor schema exposes |
| Typical latency | 50–250 ms subscription updates | Sub-second publish on change of value | 1–15 minutes on scheduled pull |
| Network load | Moderate; subscription-based, scales with tag count | Low; report-by-exception only | Low but bursty on batch pulls |
| Firewall posture | Inbound port to OPC server, usually through a DMZ broker | Outbound-only to broker, preferred by most OT security teams | Outbound HTTPS, straightforward to approve |
| Resilience to dropouts | Reconnect with subscription rebuild; gap risk on long outages | Store-and-forward at the edge node; replays on reconnect | Idempotent re-pull of the missed window |
| Effort to add a new line | Low once the server is mapped | Very low; new edge node publishes to existing topic tree | Moderate; usually requires a new query or endpoint |
| Where iFactory uses it | Filler, capper, labeler, retort, oven, and packaging line state | Compressed air, refrigeration, wastewater, remote cold storage | Lot context, planned rate, hold and release status |
Practical rule from the field: if the asset already sits on the controls network and has a maintained OPC server, subscribe to it. If the asset is remote, wireless, or behind a constrained link, publish it over MQTT with store-and-forward. Never pull production counts from a business system when a controller already holds them — the round-trip delay destroys micro-stop resolution.
Not sure which of your systems should own the OEE calculation?
Bring your line list, historian inventory, and MES version. In thirty minutes we will sketch the integration layer, name the protocol for each data source, and show where your current OEE number is drifting from reality.
Which plant signal feeds which part of the OEE equation
OEE breaks into three factors, and each one draws from a different layer of the stack. Getting the mapping wrong is the single most common reason two systems report different numbers for the same shift.
Four food plant realities that break generic OEE integrations
Integration templates built for automotive or general discrete manufacturing consistently fail in food and beverage environments. These four constraints have to be designed in from the first workshop, not patched later.
Sanitation and CIP windows are not downtime
A dairy or beverage line may spend 90 to 180 minutes per day in clean-in-place cycles that are mandatory, scheduled, and regulated. Treating them as unplanned stops drives availability into the forties and destroys credibility with the floor.
Integration pattern: subscribe to the CIP controller phase state and use it to gate the planned-production-time clock automatically, rather than relying on an operator to select a downtime reason.
Allergen changeovers carry validated hold times
Switching from a peanut-containing product to an allergen-free run requires a documented cleaning sequence and often a verification swab with a laboratory wait. That wait is neither a fault nor avoidable speed loss.
Integration pattern: pull the changeover matrix from MES so the OEE engine knows the expected standard changeover duration for each product pair, then measure the variance rather than the raw minutes.
Output is measured in mass, not units
Upstream process areas — mixing, cooking, extrusion, retort — run in kilograms or litres, while packaging runs in cases and pallets. Yield loss between the two is invisible unless the OEE model carries both unit systems and the conversion factor per SKU.
Integration pattern: normalize every count to a common base unit at ingestion, store the conversion with the SKU record, and report packaging OEE alongside process yield so the two can be reconciled.
Traceability obligations outlive the shift report
Under FSMA and GFSI-benchmarked schemes, every production record must be reconstructable long after the dashboard has rolled over. An OEE layer that aggregates and discards raw events is a liability during a recall investigation or audit.
Integration pattern: retain immutable event-level records with lot association, keep audit trails on any manual reason-code edit, and align retention policy with the plant's existing record-keeping schedule.
A six-phase rollout that reaches live OEE in eight weeks
iFactory AI deployments in food plants follow a fixed sequence designed so that the first useful number appears before the full scope is complete. Value arrives at phase three, not at go-live.
Scope and tag discovery
Line list, asset hierarchy, constraint identification, and an inventory of every historian, OPC server, and MES endpoint. Output is a signed tag map naming exactly which points feed availability, performance, and quality.
Network and security design
DMZ placement, broker topology, outbound-only firewall rules, and credential management reviewed jointly with the OT security owner. Nothing is deployed until the network diagram is approved.
Connector build and first line live
Protocol adapters configured for the pilot line, timestamps aligned to a single source, units normalized. The pilot line begins producing a continuous OEE stream that can be compared to the existing manual calculation.
Rule calibration and reason codes
Planned-downtime logic for CIP and changeover, six-big-losses taxonomy, per-SKU ideal rates, and reject-cause mapping. Supervisors validate a full week of history against their own records.
Scale to remaining lines
Connector templates are cloned across the plant. Each additional line typically takes one to two days because the tag naming pattern and rule set are already established.
Write-back and adoption
CMMS work-order triggers, andon displays, shift-handover reports, and role-based dashboards. Training is delivered by role rather than by screen, so each team learns only the view they will use daily.
Five integration failure modes and how to design around them
Almost every stalled OEE program traces back to one of these. None of them are technology problems — they are scoping and governance problems that surface as technology symptoms.
What a properly integrated OEE layer changes in twelve months
The figures below reflect typical ranges observed across food and beverage deployments where SCADA, MES, and CMMS were unified under a single OEE engine. Results vary with baseline maturity and constraint utilization.
Validation, audit readiness, and data ownership
In a regulated food environment, an analytics layer that touches production records has to satisfy the same scrutiny as any other quality-adjacent system. These are the governance items iFactory addresses during deployment.
Connectors subscribe to controller data without write permission. Any write-back — such as a CMMS work-order trigger — is explicitly scoped, logged, and separately approved.
Raw state changes, counts, and reject events are retained at source resolution. Aggregations are derived views, so an auditor can always trace a monthly figure back to the originating minute.
When a supervisor reclassifies a downtime reason, the original value, the new value, the user, and the timestamp are all preserved. Nothing is silently overwritten.
Operators, maintenance planners, quality reviewers, and plant leadership each receive scoped permissions aligned to the plant's existing access-control policy and directory groups.
For sites with strict data residency or customer confidentiality obligations, the entire platform runs inside the plant network with no outbound production data flow.
The OEE formula, planned-downtime rules, and loss taxonomy are published as configuration rather than hidden in code, so the definition can be reviewed and signed off by the quality team.
FAQ: OEE integration with SCADA and MES in food plants
See your own SCADA and MES data unified into one OEE number
Bring a single line to the session. We will show how iFactory AI maps its state tags, counts, and lot context into a live OEE calculation, where your current number is drifting, and what an eight-week rollout would look like across the rest of the plant.