Packaging Line analytics: Reducing Changeover Time and Maximizing OEE

By Josh Turley on April 7, 2026

packaging-line-analytics-reducing-changeover-time-and-maximizing-oee

Packaging line performance is the final bottleneck between a food or beverage plant's production capacity and its actual output. Changeover inefficiencies, unplanned downtime on carton sealers and label machines, and poor OEE visibility routinely cost F&B facilities thousands of dollars per shift — losses that never appear as a line item but consistently erode margin. Packaging line analytics powered by AI-driven monitoring changes this dynamic entirely, giving plant managers real-time visibility into every machine cycle, changeover event, and performance gap across the full packaging operation. Book a Demo to see how iFactory's analytics platform reduces packaging changeover time and drives measurable OEE improvement.

AI-DRIVEN ANALYTICS · OEE · CHANGEOVER · DOWNTIME · F&B PACKAGING

Packaging Line Analytics: Reduce Changeover Time and Maximize OEE

iFactory captures every machine cycle, changeover event, and downtime incident across your food packaging lines — delivering real-time OEE data, predictive PM alerts, and actionable performance insights that manual tracking cannot provide.

Why Packaging Line OEE Is the Most Undertracked KPI in Food Manufacturing

Most food and beverage plants track upstream production metrics — fill rates, batch yields, CCP temperatures — with reasonable precision. But packaging line OEE is frequently measured inaccurately or not at all. The result is a systematic blind spot: changeover time is estimated, not measured; micro-stoppages on label machines and carton sealers go unlogged; and preventive maintenance intervals are based on calendar time rather than actual run hours and cycle counts.

The cost of this blind spot compounds. A packaging line running at 68% OEE when it should be running at 82% represents a 14-percentage-point gap in effective capacity — enough, in many facilities, to eliminate the need for additional shifts or capital equipment investment. Closing that gap starts with packaging line analytics that capture the actual performance data hiding in plain sight on the production floor. Book a Demo to see the OEE dashboard that packaging engineers actually use.

68%
Average OEE for food packaging lines without analytics
85%+
OEE benchmark for world-class packaging operations
40%
Of packaging downtime attributed to changeover inefficiency
25–35%
Changeover time reduction achievable with AI-driven analytics
The Changeover Problem

How Untracked Changeover Time Destroys Packaging Line Efficiency

Changeover time — the interval between the last good unit of one SKU and the first good unit of the next — is the single largest controllable loss on most food packaging lines. Format changes on flow wrappers, tooling swaps on carton sealers, reel changes on label machines, and sanitation requirements between allergen-containing products all drive changeover duration. Without precise timing data, these events are managed by habit rather than by performance insight.

Packaging line analytics eliminates the guesswork. IoT sensors and machine signal monitoring capture the exact start and end of every changeover event, broken down by task type, operator, product transition, and equipment. Over time, this data reveals which changeovers consistently exceed target, where time is lost in each changeover sequence, and which operator teams achieve best-in-plant performance — insights that drive SMED implementation and quick-change tooling decisions with actual evidence rather than anecdote.

01
Real-Time Changeover Timing Capture
Every changeover is automatically timestamped from signal detection — no manual stopwatch, no operator estimation. Actual vs. target changeover time is tracked per product transition and compared against historical performance to identify outliers and improvement opportunities.
02
SKU Transition Performance Ranking
Not all changeovers are equal. Analytics identifies which SKU-to-SKU transitions are consistently slow — enabling production schedulers to sequence runs that minimize total changeover burden without sacrificing customer service levels.
03
Quick-Change Tooling Effectiveness Measurement
When a facility invests in quick-change tooling for carton sealers or flow wrappers, packaging line analytics quantifies the actual time saving achieved — validating the ROI and identifying whether the tooling is being used consistently across all shifts and operators.
04
SMED Implementation Tracking
Single-Minute Exchange of Die methodology requires precise before-and-after measurement. AI-driven changeover analytics provides the baseline data needed to implement SMED and the ongoing measurement to confirm that improvements are sustained across shifts and operators.
OEE Deep Dive

Packaging Line OEE Analytics: Availability, Performance, and Quality Losses Measured Automatically

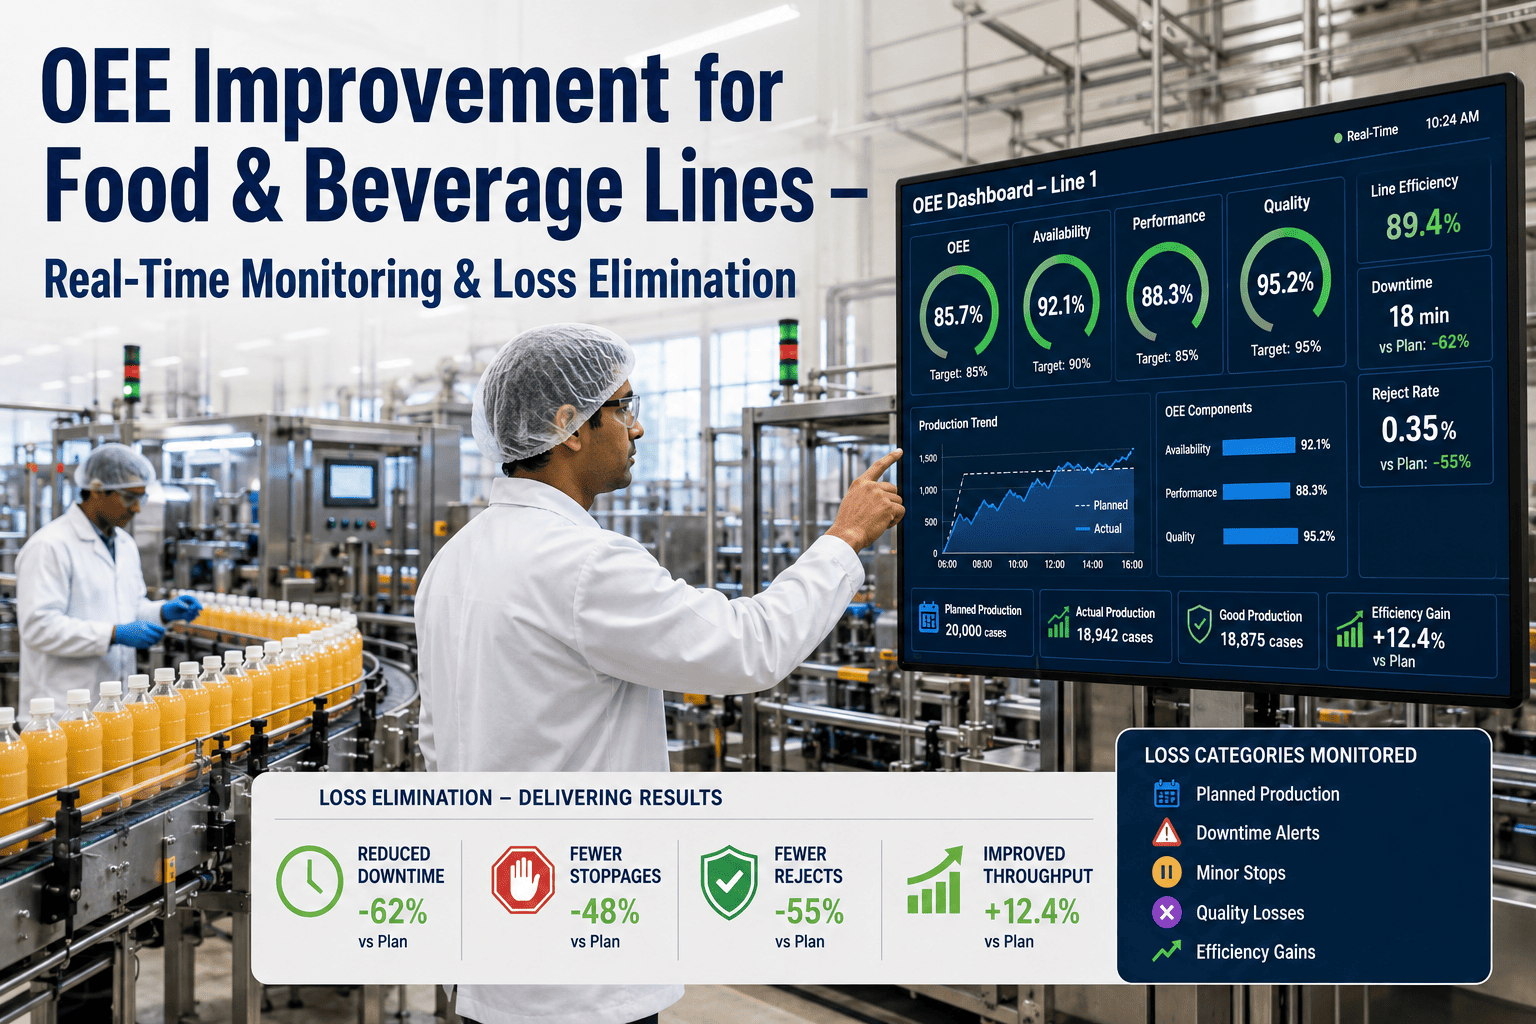
OEE — Overall Equipment Effectiveness — is the product of three factors: Availability (actual uptime vs. scheduled time), Performance (actual speed vs. rated speed), and Quality (good units vs. total units produced). Most packaging operations measure OEE inconsistently because data collection across all three factors requires manual input from multiple sources. AI-driven packaging analytics eliminates this dependency by capturing all three OEE components from machine signals and production data in real time. Book a Demo to see the full OEE dashboard live.

Availability Losses
  • Unplanned breakdowns on carton sealers, label machines, and flow wrappers
  • Changeover and format change duration
  • Waiting time for materials, operators, or upstream supply
  • Scheduled vs. unscheduled maintenance downtime
Automated detection — no manual logging required
Performance Losses
  • Reduced line speed below rated capacity
  • Minor stoppages and jams under 5 minutes
  • Speed losses from worn components or tooling
  • Operator-driven pace variation between shifts
Cycle time monitoring detects performance drift in real time
Quality Losses
  • Packaging defects: seal failures, label misapplication, overfill
  • Startup rejects during changeover and line clearance
  • Rework volumes by machine and shift
  • Consumer complaint correlation to production event data
Quality loss data linked directly to machine and operator records

Packaging Line Performance: Manual Tracking vs. AI-Driven Analytics

Operational outcomes from food and beverage packaging facilities that transitioned from manual OEE tracking to iFactory's AI-driven packaging analytics platform.

Packaging Line Analytics Comparison
Performance Metric Manual Tracking AI-Driven (iFactory) Impact
Changeover Time Measurement Estimated by operators, inconsistent Exact timestamp from machine signals ±0 seconds accuracy
OEE Calculation End-of-shift manual entry, daily lag Real-time, continuous, automated Live OEE visibility
Micro-Stoppage Logging Rarely captured, invisible in data Every stoppage detected and classified Full loss accounting
PM Schedule Optimization Calendar-based, regardless of run hours Usage-based, triggered by actual cycles 30–40% fewer unplanned stops
Shift-to-Shift Benchmarking Not available without manual comparison Automated shift performance reports Best-practice identification
Downtime Root Cause Analysis Operator recall, often inaccurate Machine signal correlated to event log Accurate failure classification
Changeover Reduction Achieved Minimal without data baseline 25–35% within first 90 days Measurable capacity gain
Equipment Coverage

Packaging Machine Analytics: Coverage Across Your Full Line

iFactory's packaging analytics layer is designed for the full spectrum of food and beverage packaging equipment — not just primary packaging machines. Every asset in the packaging line contributes to OEE loss, and every asset needs to be monitored with the same precision. Book a Demo to see coverage for your specific equipment mix.

Flow Wrappers
Cycle time monitoring, seal temperature trend tracking, film splice detection, speed performance vs. rated capacity, and changeover duration by product format.
Carton Sealers
Seal integrity monitoring, jam frequency tracking, glue system performance, tooling wear indicators, and PM interval optimization based on carton count rather than calendar.
Label Machines
Label application accuracy monitoring, reel change frequency and duration, head pressure and speed analytics, and downtime classification by fault code and shift.
Case Erectors & Packers
Throughput rate vs. rated speed, jam detection and classification, case reject rates, and synchronization performance with upstream packaging machines.
Checkweighers & Metal Detectors
Reject rate trending by shift and product, calibration verification event logging, sensitivity test tracking, and performance correlation with upstream fill equipment.
Palletizers & Stretch Wrappers
Cycle count tracking, wrap tension consistency monitoring, pallet pattern error logging, and throughput rate benchmarking against rated pallets-per-hour capacity.
Predictive Maintenance

Packaging Equipment PM Analytics: From Calendar-Based to Condition-Based Maintenance

The most common cause of unplanned packaging line downtime is not equipment failure — it is maintenance performed too late. Calendar-based PM schedules are a blunt instrument: they schedule maintenance at fixed intervals regardless of how hard a machine has actually run, leading to either over-maintenance (unnecessary downtime) or under-maintenance (failure between scheduled services).

AI-driven packaging equipment PM analytics replaces calendar schedules with condition-based triggers. By monitoring actual cycle counts, run hours, vibration signatures, seal temperatures, and other performance indicators, iFactory generates PM work orders when a machine actually needs service — not because 30 days have passed on the calendar. The result is fewer unplanned breakdowns, lower maintenance labor costs, and packaging line PM schedules that improve rather than interrupt OEE performance.

1
Connect Packaging Equipment to iFactory IoT Monitoring
Deploy sensors on critical packaging assets — flow wrappers, carton sealers, label machines — to capture real-time performance signals. Installation requires no production stoppage and completes in hours.
Outcome: Real-time machine data from day one
2
Establish OEE Baseline and Changeover Benchmarks
Within the first two weeks, iFactory's analytics engine establishes actual OEE performance and changeover duration baselines for every packaging line and product transition — giving you a factual starting point for improvement.
Outcome: Accurate OEE baseline with no manual data collection
3
Activate AI-Driven PM Triggers and Downtime Alerts
Configure condition-based PM thresholds and real-time downtime alerts. When a carton sealer approaches a maintenance trigger or a label machine records an abnormal jam frequency, the right team member receives an actionable notification — before a breakdown occurs.
Outcome: 30–40% reduction in unplanned downtime within 60 days
4
Drive Changeover Improvement with Performance Reports
Weekly changeover performance reports identify which transitions consistently exceed target and which operator teams deliver best-in-plant results. These insights drive targeted SMED projects, quick-change tooling investments, and operator training decisions backed by real data.
Outcome: 25–35% changeover time reduction within 90 days
Real-World Outcome
A mid-size snack food manufacturer operating three packaging lines implemented iFactory's analytics platform and identified that 38% of their total packaging downtime was concentrated in just two changeover transitions — both involving the same carton sealer. Within 45 days, targeted tooling changes and revised changeover sequences reduced overall packaging line downtime by 31%. OEE across all three lines improved from 71% to 84% — without adding a single shift or purchasing additional equipment.

Frequently Asked Questions: Packaging Line Analytics and OEE Improvement

How quickly can we see OEE improvement after deploying packaging line analytics?
Most F&B packaging facilities see measurable OEE improvement within 30–45 days of deployment. The analytics baseline is established in the first two weeks, and the first targeted improvement actions — changeover sequence optimization, PM schedule adjustment — typically deliver results within the first month.
Does iFactory integrate with our existing packaging equipment without replacing it?
Yes. iFactory deploys IoT sensors on existing packaging assets — flow wrappers, carton sealers, label machines — without requiring equipment replacement or modification. The platform works with legacy machines as well as modern equipment, reading machine signals and adding digital monitoring capability to assets already on your floor.
How does packaging changeover analytics support SMED implementation?
SMED requires precise measurement of current-state changeover performance to identify internal vs. external tasks and set improvement targets. iFactory provides the exact changeover timing data — broken down by task sequence and duration — that SMED teams need to prioritize improvements and verify that changes are sustained over time.
Can packaging analytics data be used for operator training and performance improvement?
Yes, and this is one of the highest-value applications. When changeover performance data shows that one shift consistently achieves target changeover times and another does not, the analytics reveal exactly where time is lost — enabling targeted coaching conversations based on objective data rather than supervisor observation alone.
How does iFactory handle packaging lines with multiple machines in sequence?
iFactory monitors each machine in the packaging line independently and also tracks line-level OEE — identifying which asset is the current constraint on throughput. When a downstream carton sealer is the bottleneck, the analytics shows it clearly, preventing improvement efforts from being directed at the wrong machine.
What reporting does iFactory provide for packaging line performance?
iFactory generates automated shift reports, weekly changeover performance summaries, monthly OEE trend analysis, and on-demand equipment reliability reports — all exportable in formats suitable for operations reviews, maintenance planning, and capital investment justification.
Transform Packaging Performance This Quarter

iFactory — AI-Driven Packaging Line Analytics for F&B Plants

Stop estimating OEE and guessing at changeover losses. iFactory's packaging analytics platform automatically captures every machine cycle, changeover event, and downtime incident across your full packaging line — delivering the real-time performance data that drives measurable OEE improvement and sustainable changeover reduction.
Real-time OEE monitoring across all packaging assets
Automated changeover timing with SMED-ready data
Condition-based PM triggers for carton sealers and label machines
Micro-stoppage detection and automated classification
Shift-to-shift performance benchmarking and trend reports
SKU transition analysis for scheduling optimization

Share This Story, Choose Your Platform!