A line supervisor's day is largely a series of reactions to problems they find out about too late — a machine that's been down for twenty minutes before anyone walks over to check, a jam that started three stations back and only gets noticed once it backs up the whole line. Real-time downtime visibility changes the shape of that day entirely, because the moment a line stops, the supervisor already knows, already knows why, and is already moving toward a fix instead of discovering the problem on a walk-through. That shift from reactive to proactive is the entire value proposition, and it shows up directly in recovered production hours. Contact our support team to see how live downtime visibility fits your current floor layout.
Floor Visibility · Food Line Operations
Real-Time Downtime Visibility Built for Food Line Supervisors
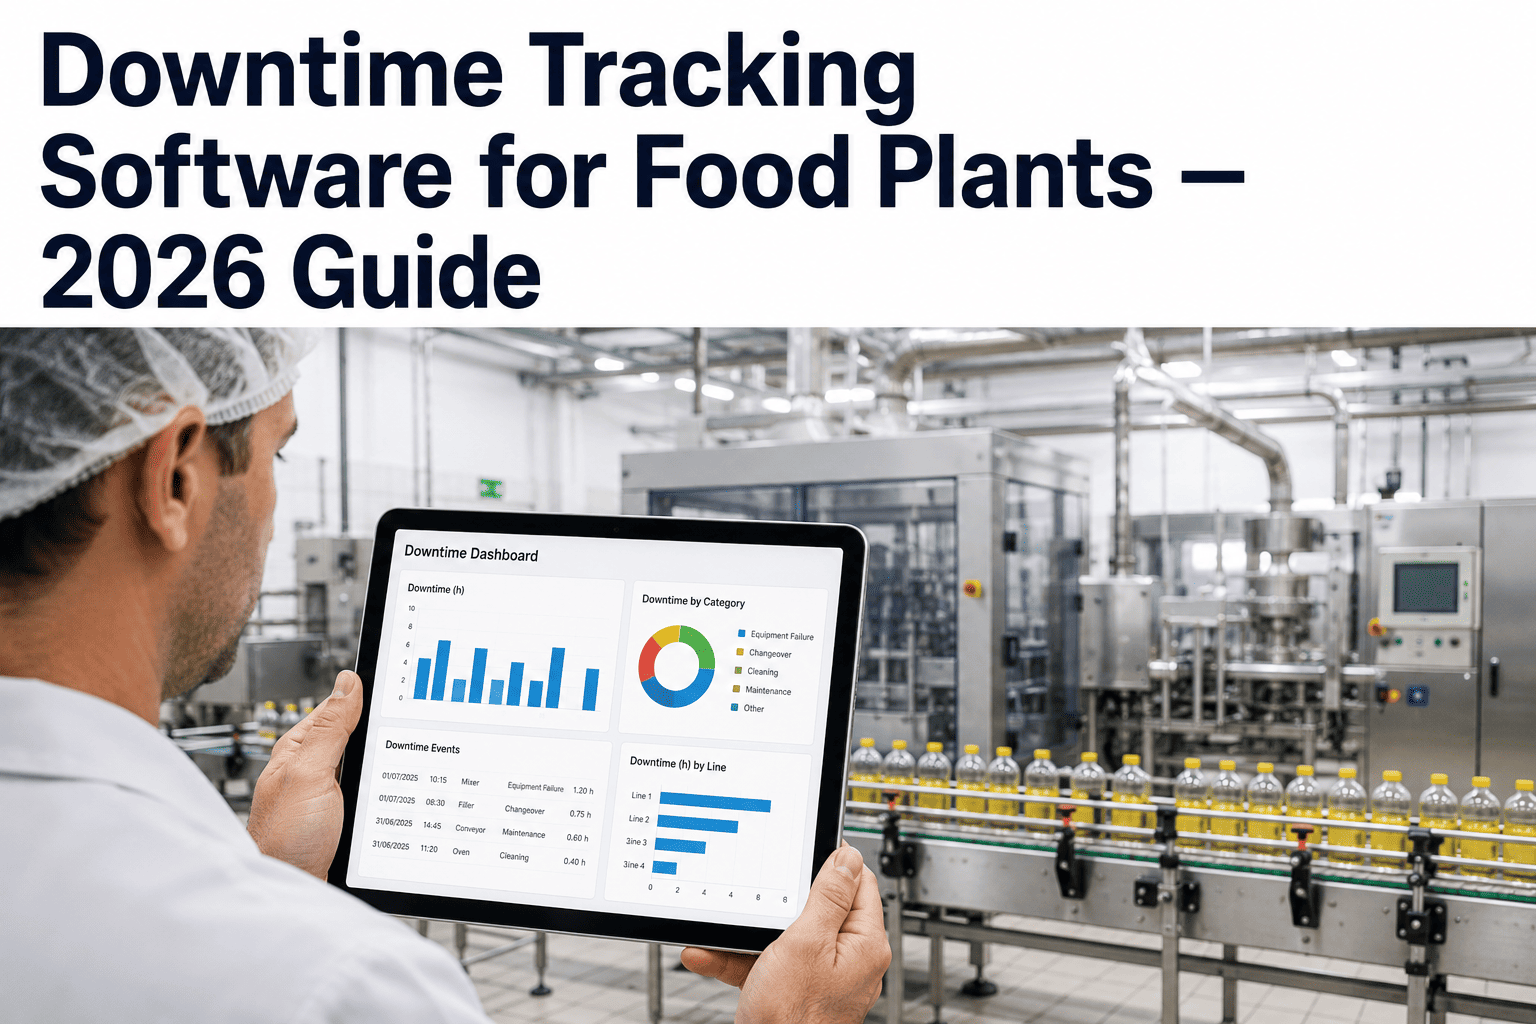
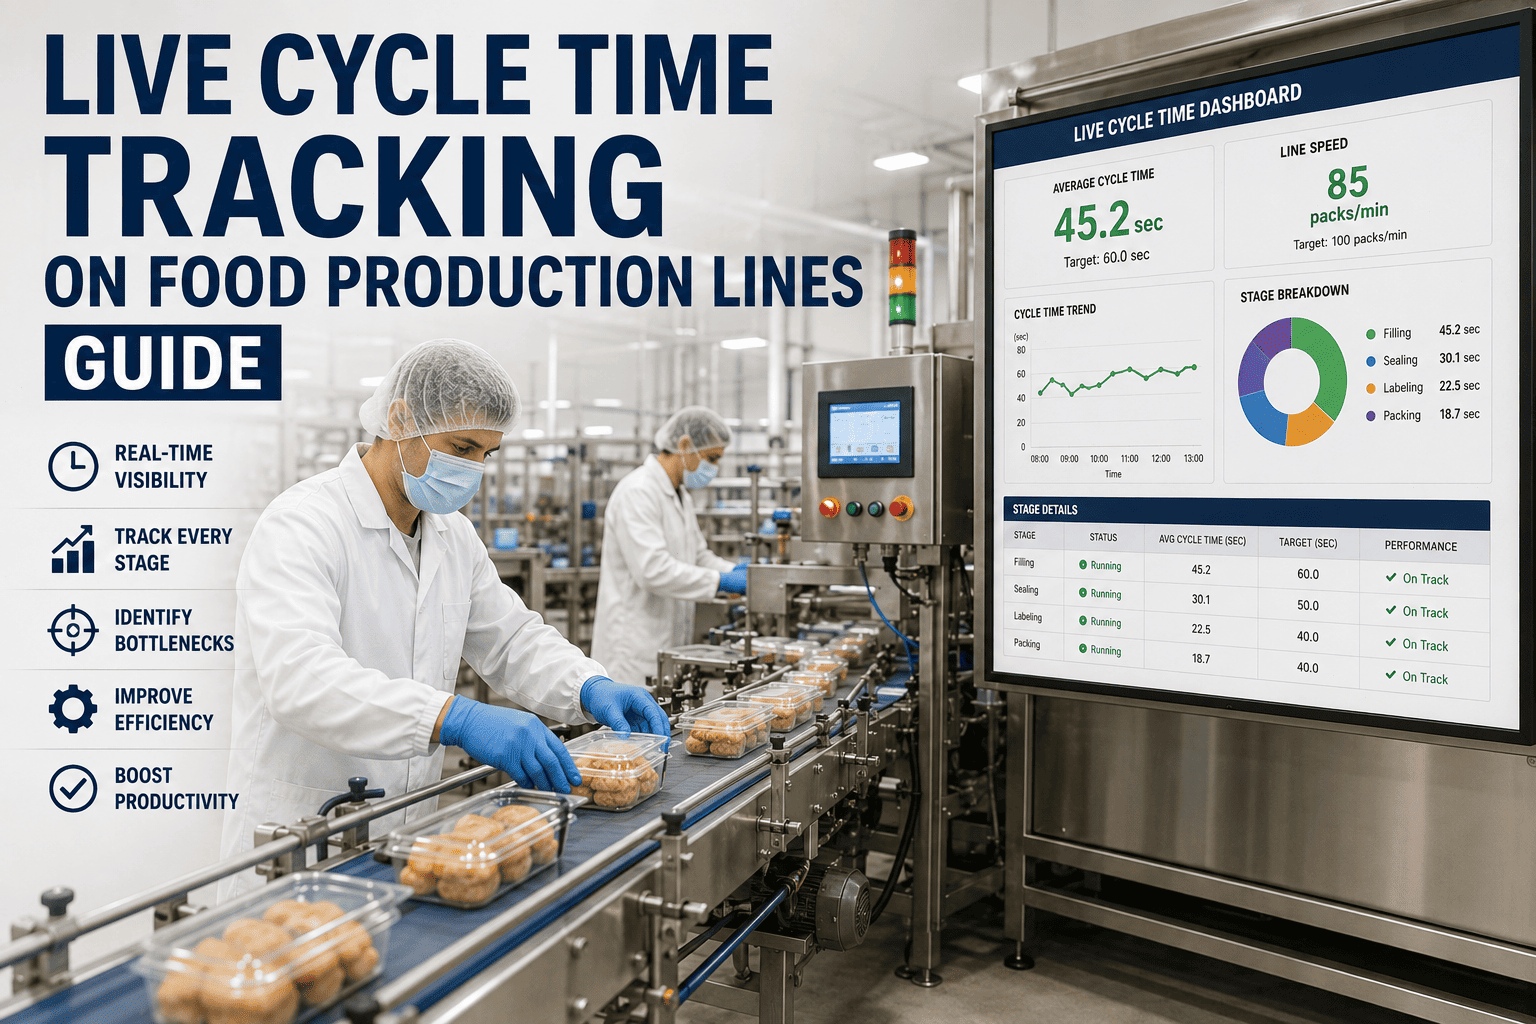
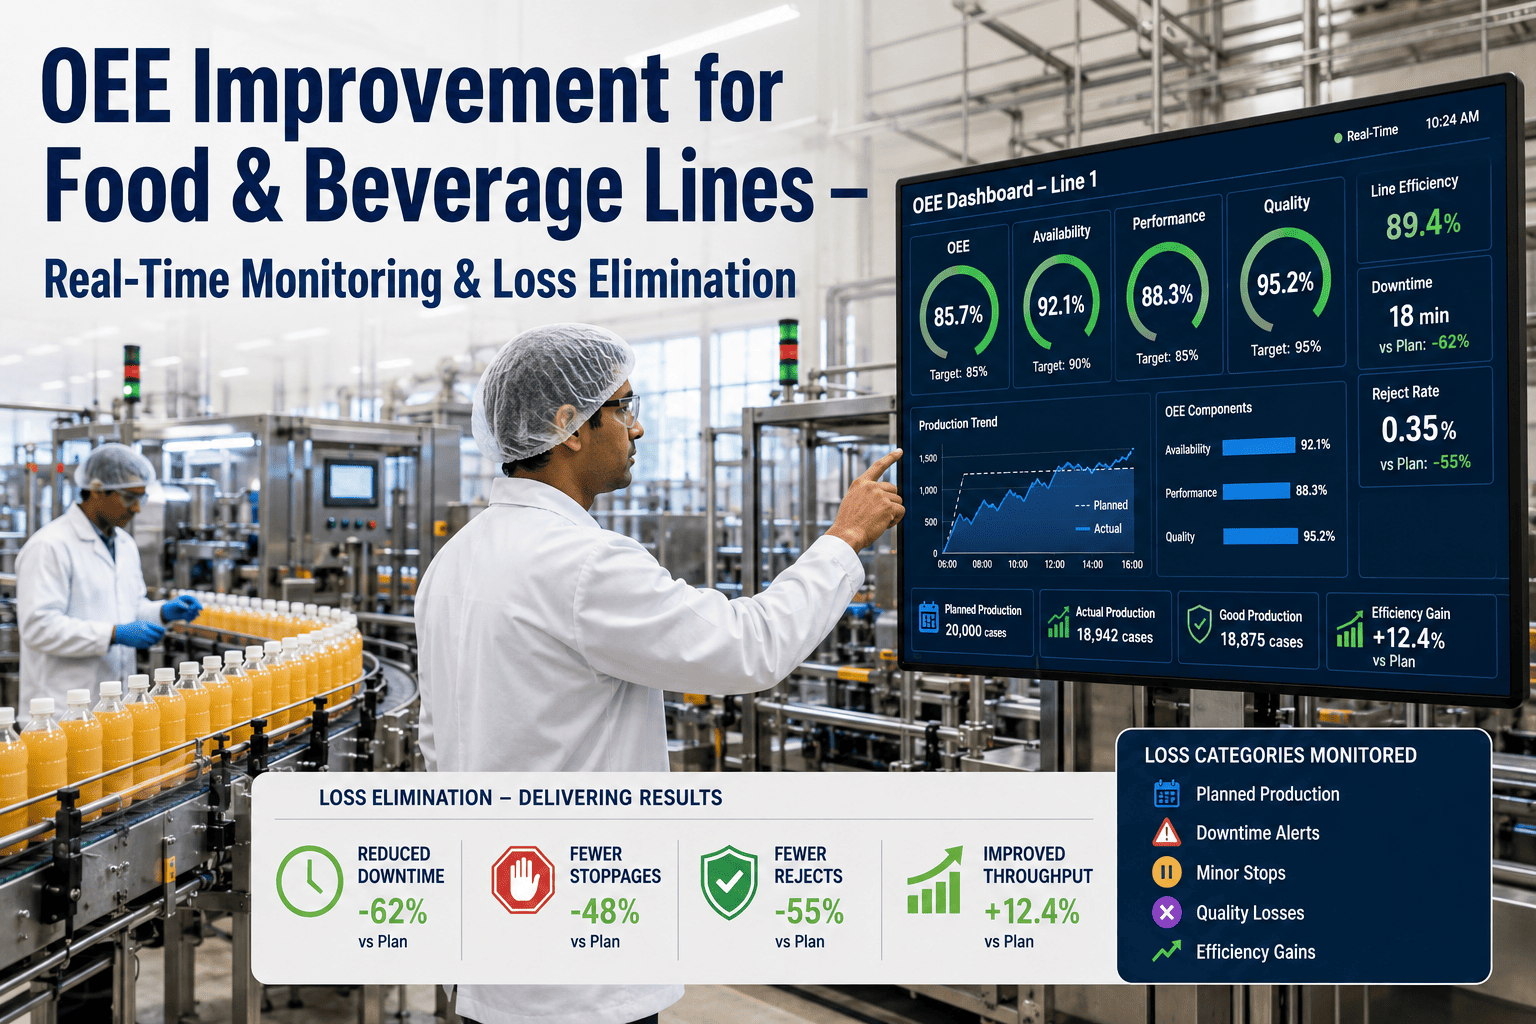
Live line status, active downtime duration, and cause categorization pushed to mobile devices and floor screens across every line, so a stoppage gets a response in minutes instead of a walk-through.
The Shift This Solves
Reactive Downtime Response vs. Proactive Downtime Response
Without Live Visibility
A line goes down, and the first person to notice is whoever happens to walk past it, sometimes minutes after the actual stop. The cause gets diagnosed on the spot with no prior context, and the total downtime duration only becomes clear once someone checks the clock against when the stop was first noticed, not when it actually started.
With Live Visibility
The stoppage triggers an immediate alert to the supervisor's device the moment it happens, with the line, the machine, and often an initial cause category already attached. Response starts within moments of the actual stop, not the moment someone happens to notice it, and the full duration is captured accurately from the true start time.
Making Sense of the Data
How Downtime Gets Categorized for Useful Reporting
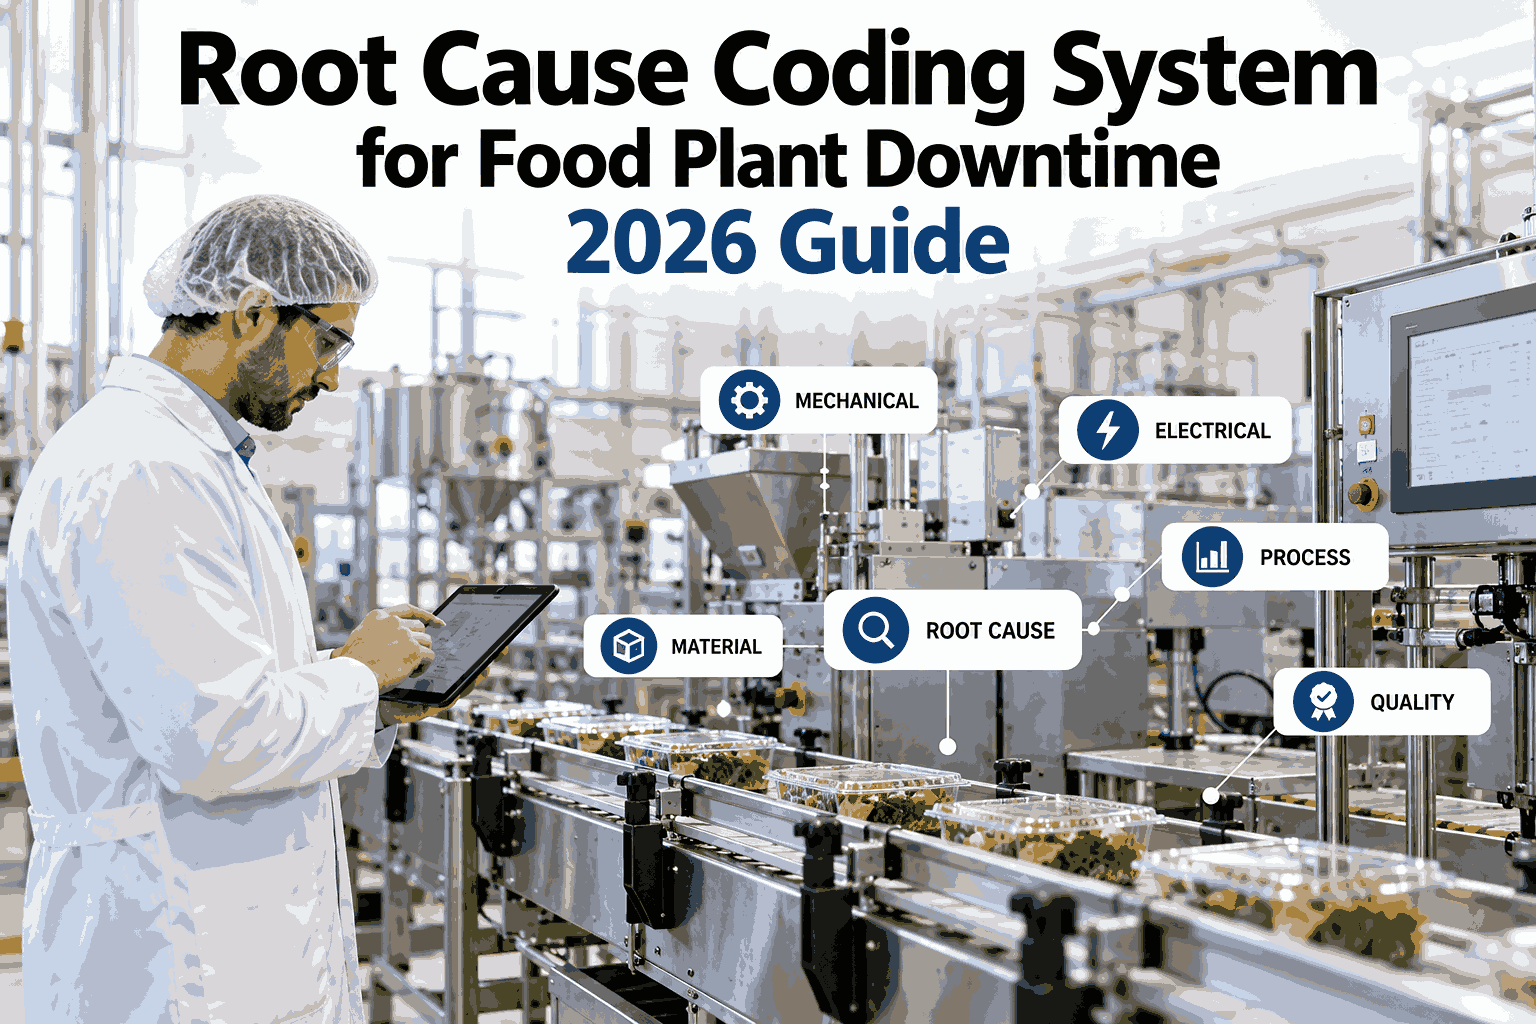
Mechanical Failure
Equipment breakdown requiring maintenance intervention, tracked separately so recurring mechanical patterns on a specific asset become visible over time.
Material Shortage
Line stopped waiting on ingredients, packaging, or components, a category that often points to supply chain or scheduling issues rather than equipment problems.
Changeover
Planned stoppage for product or format switch, tracked to identify which changeovers consistently run longer than their target duration.
Quality Hold
Line paused pending a quality check or disposition decision, distinct from mechanical downtime and often addressable through process rather than equipment changes.
See Every Stop as It Happens
iFactory Puts Live Downtime Status on Every Supervisor's Device
The moment a line stops, your supervisors know which line, how long, and why, on mobile or on the floor screen, so response time is measured in minutes instead of however long it takes someone to walk over and look.
What Actually Shows Up
The Core Elements of a Useful Live Downtime View
Current Line Status at a Glance
Every line shown as running, stopped, or in changeover, with color-coded status that a supervisor can scan across the whole floor in a few seconds without opening individual line details.
Active Downtime Duration, Live
A running clock on any currently stopped line, so it's immediately obvious which stoppage has been going the longest and therefore needs the most urgent attention first.
Cause Category Tagging
An initial cause category attached automatically where possible, or a quick manual tag from the operator, so the supervisor arrives with context instead of starting the diagnosis from zero.
Shift and Daily Downtime Totals
Running totals by cause category across the shift, giving supervisors a sense of whether today's pattern is normal or trending toward a problem worth escalating before the shift ends.
The Measurable Difference
Before and After Live Downtime Visibility
| Measure | Without Live Visibility | With Live Visibility |
|---|---|---|
| Time to first response | Minutes to tens of minutes | Near-immediate, alert-driven |
| Downtime duration accuracy | Undercounted from discovery lag | Accurate from true stop time |
| Cause data quality | Reconstructed after the fact | Captured live and consistently |
| Escalation timing | Manual, often delayed | Rule-based, triggered automatically |
When a Stop Runs Long
A Typical Escalation Workflow for Extended Downtime
01
Stop Detected, Operator Notified
The line status changes and the operator's device shows the active stop timer along with a prompt to select a cause category if one wasn't auto-detected.
02
Supervisor Alerted at a Set Threshold
If the stop passes a defined duration, typically a few minutes, the assigned supervisor gets an automatic alert with the line, duration, and cause category attached.
03
Maintenance Looped In If Mechanical
For mechanical cause categories, a maintenance work request can be triggered automatically once the stop crosses the alert threshold, shortening the gap between detection and repair start.
04
Plant Manager Notified for Extended Stops
A second, longer threshold escalates visibility to the plant manager level, ensuring genuinely significant stoppages get attention beyond just the line supervisor.
The single biggest change I've seen after implementing live downtime visibility isn't the dashboard itself, it's how much faster maintenance gets engaged. When a mechanical stop automatically generates a work request the moment it crosses a few minutes, you cut out the gap where a supervisor has to notice, diagnose, and then walk over to find a technician. That gap is often the largest chunk of total downtime, bigger than the actual repair time itself.
Priya Nakashima-Delacroix
Maintenance and Reliability Manager · 13 years in food and beverage plant operations
Common Questions
Real-Time Downtime Visibility — Frequently Asked
How is a stop actually detected without relying on an operator to report it?
Most systems detect a stop directly from a machine signal, such as a lack of encoder pulses or a PLC status change indicating the equipment has halted, rather than waiting for a person to manually flag it. This removes the reporting delay entirely, since detection happens the instant the line actually stops rather than whenever someone gets around to logging it. Operator input is typically still used to confirm or refine the cause category, but the stop and duration themselves are captured automatically.
Can escalation thresholds be set differently for different lines or downtime causes?
Yes, thresholds are typically configurable per line and often per cause category, since a two-minute stop on a bottleneck line might warrant immediate attention while the same duration on a lower-priority line might not need escalation at all. This flexibility lets plants tune the alerting to match actual operational priorities instead of applying one blanket rule across every line regardless of its role in the overall production flow.
Does live downtime tracking require replacing existing floor display screens?
No, most live downtime platforms are designed to work with whatever display infrastructure a plant already has, whether that's existing floor monitors, tablets, or supervisor mobile devices, rather than requiring new dedicated hardware. Contact our support team to review what's compatible with your current floor setup before any purchase decision.
How does this data connect to broader OEE or downtime reporting?
Live downtime events feed directly into the same underlying data used for shift, daily, and trend-level OEE reporting, so there's no separate manual reconciliation step between what supervisors see in real time and what shows up in the aggregate reports reviewed later. This consistency also means the categorized cause data captured live is the same data driving root-cause trend analysis over longer periods.
Is this practical for plants with older equipment that lacks modern connectivity?
Yes, older equipment can typically still be integrated through a retrofit sensor or a simple discrete input that detects run versus stopped state, even without full modern connectivity built into the machine itself. This means plants don't need to wait for a full equipment refresh to gain live downtime visibility across their existing lines. Book a demo to discuss integration options for your specific equipment mix.
Cut the Discovery Lag
Know the Moment a Line Stops, Not Whenever Someone Walks Past
iFactory pushes live line status, downtime duration, and cause categorization to your supervisors' devices the instant a stop happens, cutting response time from minutes to moments.