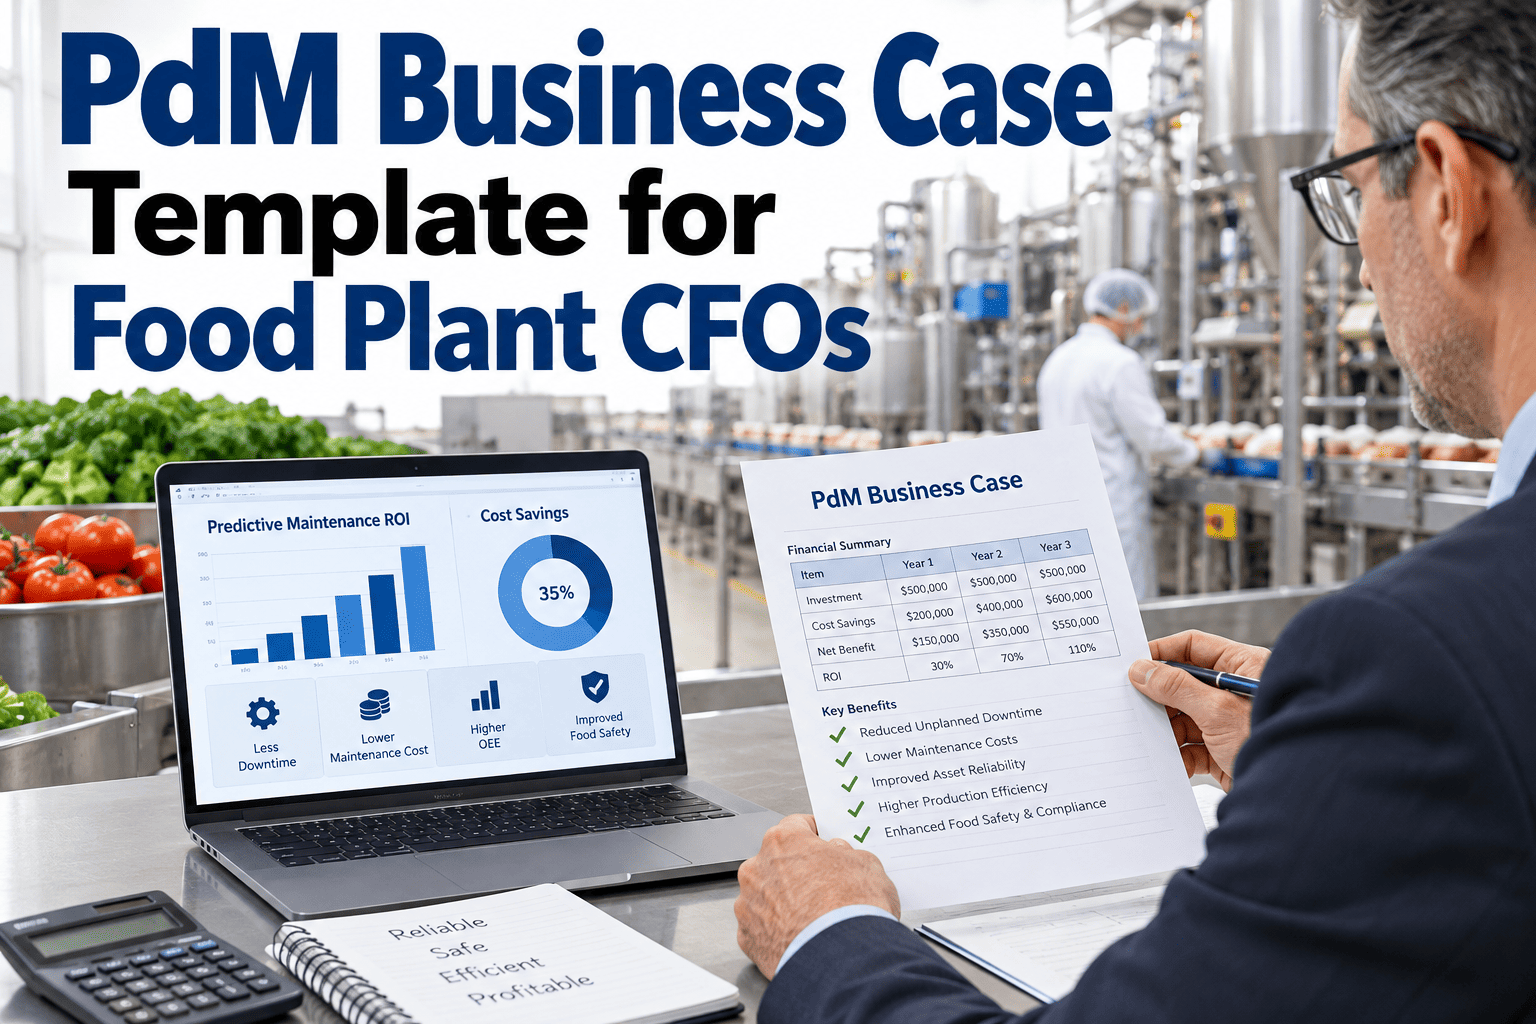
Predictive maintenance proposals routinely stall in the capital committee room, not because the technology case is weak, but because the financial case underneath it is thin — a single ROI percentage with no visible assumptions, no sensitivity range, and no way for a CFO to defend the number if it gets challenged. Food and beverage plants carry a distinct cost profile: short shelf-life inventory, fixed sanitation windows, and refrigeration-dependent lines where one unplanned failure can cascade into spoilage losses that a generic manufacturing ROI template never accounts for. A business case built on borrowed industrial assumptions rarely survives scrutiny from a finance team that already knows the plant's real cost structure. Building a case that actually holds up starts with modeling PdM in the financial language a food plant capital committee uses every quarter, and the gap between a rejected deck and an approved one usually comes down to what gets walked through in a working session with iFactory.
Capital Planning · Predictive Maintenance
PdM Business Case Template for Food Plant CFOs
A finance-grade structure for assumptions, NPV, IRR, and payback — built around spoilage risk, sanitation windows, and cold-chain exposure, so the model survives capital committee questions instead of inviting them.
Year 3
Cumulative Positive
Typical cumulative cash position shape for a mid-sized food plant PdM rollout
Why Capital Committees Push Back
The Deck Usually Fails Before the Technology Gets Questioned
Most PdM proposals that reach a food plant capital committee get stopped on finance grounds, not engineering ones. The pattern repeats across plants of very different sizes and product lines.
01
One Blended ROI Number
A single headline percentage with no visible year-by-year build gives the committee nothing to interrogate except the number itself, which invites rejection rather than dialogue.
02
Generic Downtime Cost
Industrial downtime templates price an hour of stoppage the same everywhere, ignoring that a failed compressor on a frozen line can spoil an entire batch in a way a dry-goods line never does.
03
No Sensitivity Range
A point estimate collapses the moment a finance reviewer asks what happens if failure reduction lands at half the assumed rate, because there is no range already built to answer that.
04
Missing Discount Rate Logic
Savings are frequently summed without discounting to present value, which overstates the case and is usually the first thing a finance-literate reviewer corrects in the room.
Business Case Structure
The Seven Line Items a Food Plant Capital Committee Actually Reads
A model that survives review is not more complicated than a rejected one — it is simply structured so each assumption can be checked, questioned, and defended on its own.
Line Item
What It Captures
Typical Range
Avoided Spoilage Loss
Product value at risk when refrigeration or process assets fail mid-run
15–30% of total benefit
Unplanned Downtime Avoided
Lost production hours priced against actual line throughput and margin
25–40% of total benefit
Maintenance Labor Efficiency
Shift from reactive callouts and overtime to scheduled, planned work
10–18% of total benefit
Sanitation Window Recovery
Reclaimed CIP and changeover time when equipment failures no longer eat into scheduled downtime
5–12% of total benefit
Compliance Risk Reduction
Fewer unplanned events that risk a documented cold-chain or HACCP deviation
5–10% of total benefit
Implementation Cost
Sensors, software, integration labor, and training across the rollout period
One-time plus annual license
Discount Rate
Plant or corporate hurdle rate applied to convert future savings to present value
8–12% typical
The Three Numbers That Get Questioned
NPV, IRR, and Payback — What Each One Actually Tells the Committee
Net Present Value
NPV converts every future year of avoided spoilage, downtime, and labor savings into today's dollars using the plant's discount rate, then nets out implementation cost. A positive NPV means the project creates value beyond what the capital would earn parked elsewhere, which is usually the single number a CFO checks first.
Internal Rate of Return
IRR is the discount rate at which the project's NPV would equal zero, giving the committee a single percentage to compare directly against the corporate hurdle rate and against competing capital requests from other plants in the same budget cycle.
Payback Period
Payback answers a simpler, more immediate question than NPV or IRR: how many months until cumulative avoided cost covers the initial spend. Food plant committees weigh this heavily because working capital cycles are typically shorter than in heavy industrial capital planning.
Sensitivity Analysis
Which Assumptions Actually Move the NPV Outcome
A single-point business case breaks under the first hard question. A range-based model, built around the assumptions that matter most, turns that question into a normal part of the review.
Failure Reduction Rate
High Sensitivity
Spoilage Cost per Incident
High Sensitivity
Discount Rate
Moderate Sensitivity
Sensor and License Cost
Moderate Sensitivity
Labor Efficiency Gain
Lower Sensitivity
Presenting the model at low, base, and high failure-reduction scenarios, rather than a single case, is usually what shifts a committee from questioning the number to questioning the timeline instead.
A Business Case With No Sensitivity Range Is Not a Model. It Is a Guess With a Decimal Point.
Build the version with a defensible range built in, before it reaches the committee.
Spreadsheet Model vs. Supported Financial Model
Where a DIY Business Case Usually Breaks Down
Aspect
Spreadsheet Estimate
iFactory-Supported Model
Downtime Cost Basis
Rough per-hour estimate applied uniformly across all lines
Line-specific rates that account for spoilage risk and product value at loss
Failure Reduction Assumption
Borrowed from a vendor benchmark or industry average
Modeled against your plant's own historical failure and callout data
Sensitivity Range
Usually absent, or added only after the first committee pushback
Built in from the first draft across low, base, and high scenarios
Discounting Method
Frequently simple payback only, without present value adjustment
NPV and IRR calculated against the plant's stated hurdle rate
Update Cycle
Static file that goes stale as soon as actual results diverge from plan
Refreshed against live plant data as the rollout progresses
Field Example
Rebuilding a Rejected Business Case for a Frozen Foods Plant
A mid-sized frozen foods plant brought a PdM proposal to its capital committee twice in one fiscal year and was declined both times. The first version used a single blended ROI figure drawn from a vendor case study at a different plant type, and the second added more detail on the technology but still had no sensitivity range attached to the savings figure.
The finance team rebuilt the model around the plant's own compressor and blast-freezer failure history over the prior eighteen months, priced spoilage per incident against actual product value on the affected lines, and presented three scenarios instead of one. The base case IRR sat comfortably above the corporate hurdle rate, and even the low case cleared it, which changed the nature of the committee discussion entirely.
The proposal was approved on its third submission, with the committee specifically citing the visible sensitivity range as the reason the model was credible enough to act on without further revision.
2 rejections
Before the model was rebuilt around plant-specific data
18 months
Of failure history used to anchor the assumptions
3rd pass
Approved once the sensitivity range was visible
What Changes Once the Model Holds Up
Outcomes Finance Teams Report After Rebuilding the Case
Faster
Committee Approval
Proposals with a visible sensitivity range and plant-specific downtime cost typically clear committee review in fewer submission cycles.
Defensible
Assumption Trail
Each line item traces back to a specific data source, so a follow-up question has an immediate answer instead of a revision request.
Comparable
Across Capital Requests
A standardized NPV and IRR structure lets the committee compare a PdM request against other plant capital projects on equal footing.
Reusable
For Future Rollouts
Once one line's business case is built and approved, the same structure carries forward to the next line or plant with far less rebuild effort.
Tracked
Against Actuals
Post-implementation, actual avoided downtime and spoilage figures are checked against the original model, closing the loop finance teams rarely get otherwise.
Credible
Beyond the First Project
A model the committee trusted once tends to get a lighter review the second time a related capital request comes through.
Frequently Asked Questions
What Food Plant Finance Teams Ask Before Building the Model
What discount rate should a food plant use for a PdM business case?
Most food and beverage plants apply the same weighted average cost of capital or corporate hurdle rate used for any other capital project, typically somewhere between eight and twelve percent, rather than inventing a separate rate for maintenance technology. Using the same rate the committee already applies elsewhere keeps the PdM proposal comparable to competing capital requests instead of looking like a special case with its own rules. If your plant's finance team has not stated a hurdle rate explicitly, that is worth confirming before the model is built, since it is usually the single input that most affects the final NPV figure. A walkthrough of how this gets applied is available through
a session with the iFactory team.
How should spoilage risk be priced differently from generic downtime cost?
Generic downtime templates price an hour of stoppage as lost production capacity alone, which understates the real exposure on refrigeration-dependent or short shelf-life lines. Spoilage risk needs to be priced as the value of product actively in process or in cold storage at the moment of failure, which can be several times higher than the production-capacity figure alone, particularly on frozen or dairy lines where a compressor failure can affect an entire batch within hours. The most defensible approach uses your plant's own historical incident data rather than an industry average, since spoilage exposure varies significantly by product type, batch size, and how quickly a failure is detected and responded to.
How many scenarios should a sensitivity analysis include?
Three scenarios — low, base, and high — cover most committee questions without making the model unnecessarily complex to present or defend. The low case should reflect a conservative failure reduction assumption, roughly half of what the base case assumes, since this is usually the first number a skeptical reviewer challenges. The high case does not need to be aggressive; it primarily demonstrates that the model has upside built in rather than being a best-case fiction. Presenting all three side by side, rather than burying the range in an appendix, is generally what shifts committee conversation away from doubting the number toward discussing implementation timing instead.
Should implementation cost include training and integration labor, or just hardware and software?
A business case that only prices sensors and software licenses without integration labor, training time, and change management effort tends to understate cost enough that actual spend later exceeds the approved budget, which damages credibility for the next capital request. A complete model separates one-time implementation cost, which includes sensor installation, system integration, and initial training, from ongoing annual cost, which covers software licensing and periodic recalibration. Food plants in particular should account for validation and documentation time if the affected lines fall under existing HACCP or food safety compliance procedures, since that step is often missed in generic industrial templates.
How long does it typically take to build a defensible PdM business case for a food plant?
Building a first version with plant-specific failure history, spoilage pricing, and a three-scenario sensitivity range typically takes two to four weeks, depending on how readily maintenance callout and downtime data can be pulled from existing records. Plants with maintenance history already logged in a CMMS or similar system move faster, since the failure rate and cost data needed for the model already exists rather than requiring manual reconstruction from work orders. Reach out through
iFactory support for help structuring the data pull, or book time directly to walk through building the model against your own plant's numbers.
Stop Resubmitting the Same Business Case With a Different Cover Page.
Build a PdM model with the assumptions, sensitivity range, and NPV structure your capital committee already expects to see.