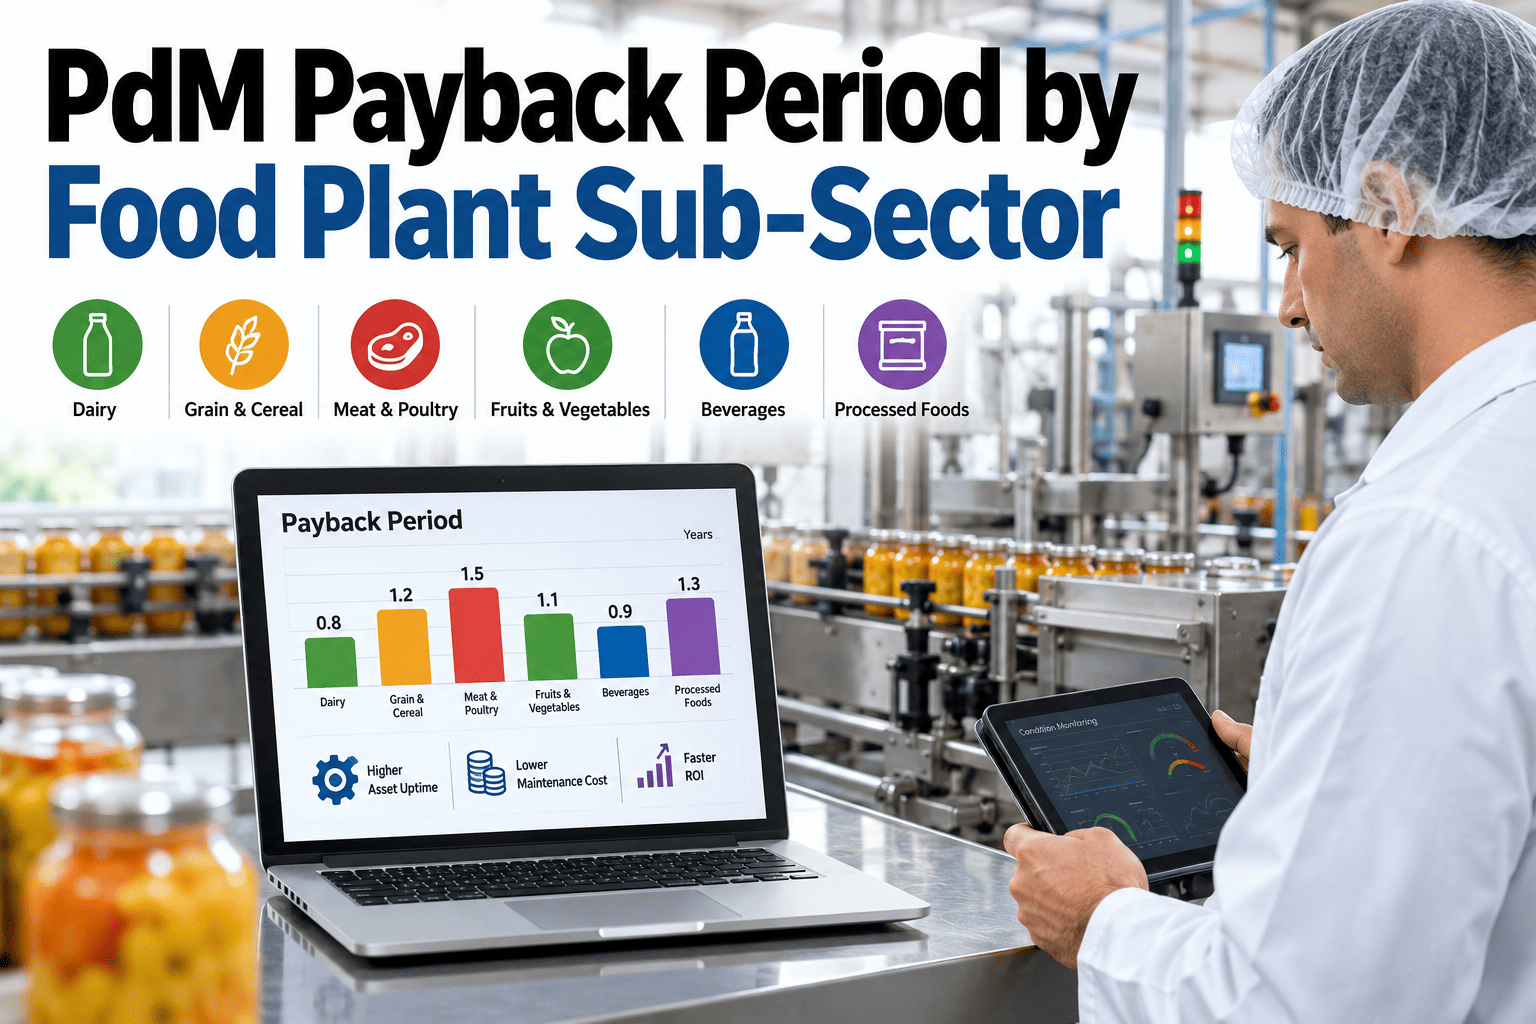
The question every plant manager asks before signing off on predictive maintenance is simple — how long until it pays for itself — and the honest answer depends far more on what kind of food plant is asking than most vendors admit upfront. A dairy line with three CIP-dependent pumps pays back on a different timeline than a beverage bottling line running at twice the speed with one clear bottleneck, and treating both with the same generic eighteen-month figure sets the wrong expectation before the project even starts. This page breaks down realistic PdM payback periods by food plant sub-sector — dairy, bakery, snack, beverage, and meat — using phased ROI curves built around asset criticality and line speed rather than a single averaged number, and you can walk through your own plant's curve with iFactory's team directly.
Predictive Maintenance ROI · Food & Beverage
PdM Payback Period by Food Plant Sub-Sector
Phased payback curves for dairy, bakery, snack, beverage, and meat plants, built around which assets are actually monitored first and how fast the line behind them runs.
Cumulative value realized toward full payback, representative curve across sub-sectors
Why One Payback Number Misleads
Sub-Sector, Not Industry Average, Sets the Real Timeline
Vendors quoting a flat "12 to 18 months" figure are averaging across plants that have almost nothing in common operationally. What actually sets the payback clock is which assets get monitored first, how much a stoppage on that asset costs per hour, and how quickly failures were previously showing up unannounced.
01
Asset Criticality Mix Differs
A plant with three or four true bottleneck assets pays back faster than one where criticality is spread thin across a dozen roughly equal machines.
02
Line Speed Changes the Math
High-speed lines lose more units per minute of unplanned stoppage, so avoided failures on those lines return value faster than the same failure avoided on a slower line.
03
Existing Maintenance Maturity Varies
A plant already running disciplined preventive maintenance has less low-hanging fruit than one still largely reactive, which shortens or lengthens the early-phase win rate accordingly.
04
Sensor Scope at Rollout
Starting with a focused set of critical assets returns value faster than a broad, thin rollout that spreads sensor coverage before any single asset shows a clear win.
Payback by Sub-Sector
Realistic Payback Ranges Across Food & Beverage Categories
These ranges reflect payback for a phased rollout starting with the highest-criticality assets, not a full-plant sensor deployment on day one.
Beverage Bottling & Canning
6 – 11 months
High line speed means avoided fillers and capper failures return value quickly, usually the fastest-paying sub-sector.
Meat & Poultry Processing
7 – 13 months
Refrigeration and compressor monitoring carries added weight here since a failure risks both downtime and perishable product loss.
Dairy Processing
8 – 14 months
CIP-dependent pumps and separators are the highest-value early targets, with payback tracking closely to how quickly those assets are brought online.
Confectionery & Dry Snacks
9 – 15 months
Packaging line speed drives most of the early value, while process-side equipment tends to pay back on a longer, second-phase timeline.
Bakery & Baked Goods
10 – 16 months
Oven and proofer-related failures are lower frequency but higher severity, which stretches the timeline needed to accumulate enough avoided events.
Asset Criticality Tiers
Where a Plant Starts Matters More Than Industry Type
Inside any sub-sector, the tier of asset monitored first is the single biggest lever on payback speed, which is why rollout sequencing matters as much as the technology itself.
Tier 1 — Bottleneck Critical
4 – 9 months
Assets that halt the entire line or plant on failure, with no redundancy and a high per-hour downtime cost behind them.
Tier 2 — Important, Limited Redundancy
9 – 15 months
Assets with partial backup or buffer capacity that reduce, but do not eliminate, the impact of an unplanned failure.
Tier 3 — Balance of Plant
15 – 24+ months
Lower-impact assets best monitored once the program has already proven value on the tiers above it.
Line Speed Correlation
Faster Lines Recover the Investment Sooner
High-Speed Lines
300+ units per minute
Every minute of avoided downtime represents a large unit count, so even a small reduction in unplanned stops shows up quickly in the payback calculation.
Mid-Speed Lines
100–300 units per minute
Payback tracks closer to the sub-sector average, with asset criticality doing more of the work than raw line speed alone.
Lower-Speed Lines
Below 100 units per minute
Payback leans more heavily on avoided severity events, such as full batch loss or extended repair windows, rather than volume of units lost per minute.
Your Actual Payback Depends on Which Assets Go Live First, Not Which Industry You're In.
A short working session maps your critical assets, line speeds, and current failure history into a payback curve specific to your plant.
The Phased ROI Curve
How Value Accumulates Across a Rollout
Phase 1
Months 1–6 — Critical Asset Monitoring
Sensors go live on the small set of Tier 1 assets first. Early wins come from catching one or two failures that would otherwise have caused an extended stoppage, building internal confidence in the program.
Phase 2
Months 6–12 — Core Rollout Expansion
Coverage extends to Tier 2 assets and any additional lines. This phase typically delivers the majority of cumulative savings as monitoring scope catches up to where most unplanned downtime actually originates.
Phase 3
Months 12–24 — Full Maturity
Tier 3 assets are added, alert thresholds are tuned against a full year of data, and the program shifts from proving value to sustaining it as a standard part of maintenance planning.
Reactive vs Phased PdM Cost Trajectory
Where the Two Paths Actually Diverge Over Two Years
Timeframe
Reactive Maintenance
Phased PdM Rollout
Months 1–6
Unplanned failures continue at historical rate, full cost
Sensor cost incurred, first critical-asset failures caught early
Months 6–12
Failure cost holds steady or rises with aging equipment
Coverage expands, avoided-failure savings begin outweighing program cost
Months 12–24
Cumulative downtime cost compounds with no structural change
Program reaches full payback and continues generating net savings
Field Example
A Beverage Plant That Reached Payback in Eight Months
A mid-size beverage bottler with a single high-speed filling line as its clear bottleneck started PdM monitoring on the filler's drive motors and the capper, the two assets responsible for the majority of prior unplanned stoppages, rather than attempting plant-wide coverage from the start.
Within the first four months, vibration monitoring flagged a developing bearing fault on the filler drive motor that would very likely have caused a multi-shift failure during a peak production week, and the repair was scheduled during planned downtime instead.
That single avoided failure, combined with two smaller caught issues on the capper, covered the majority of the program's first-year cost. Full payback across the initial sensor investment was reached at roughly eight months, faster than the sub-sector's typical range because the rollout started precisely where the highest criticality and highest line speed intersected.
8 Months
Time to full payback
2 Assets
Monitored in initial rollout phase
1 Failure
Caught event that covered most of year-one cost
Frequently Asked Questions
What Plant Teams Ask Before Starting PdM
Which sub-sector typically sees the fastest PdM payback?
Beverage bottling and canning tends to pay back fastest, usually within six to eleven months, because high line speed means even a small reduction in unplanned stoppages recovers value quickly. Meat and poultry follows closely due to the added weight of perishable product risk.
Book a demo to see where your own line speed and criticality mix would land.
Should a plant monitor every asset at once or start with a smaller set?
Starting with a small set of Tier 1 critical assets consistently produces faster payback than a broad, thin rollout across many machines at once. Concentrated coverage on the highest-impact assets is what generates the early wins that fund and justify expansion.
Book a demo to map which assets in your plant belong in that first phase.
How is asset criticality actually determined for sequencing?
Criticality combines downtime cost per hour, redundancy or buffer capacity, and historical failure frequency for each asset, ranked together rather than judged on any single factor alone. Assets with no redundancy and high downtime cost consistently rank Tier 1 regardless of sub-sector. Reach out through
iFactory support to walk through how this ranking applies to your current asset list.
Does existing preventive maintenance maturity change the payback timeline?
Yes — plants still largely reactive tend to see faster early-phase wins since there is more low-hanging fruit for PdM to catch. Plants with disciplined preventive maintenance already in place see a longer early phase but often a more predictable overall curve.
Book a demo to discuss how your current maintenance program factors into the estimate.
What happens if a plant has multiple sub-sectors under one roof?
Mixed-use facilities, such as a plant running both dairy and packaged snack lines, are scoped by asset and line rather than by a single blended sub-sector figure, since criticality and line speed still vary machine to machine. Each line effectively gets its own phased curve within the same overall rollout.
Book a demo to scope a mixed-facility rollout against your specific lines.
Stop Estimating Payback With an Industry Average That Isn't Yours.
Get a phased PdM payback curve built around your own critical assets and line speeds, not a generic sub-sector figure.