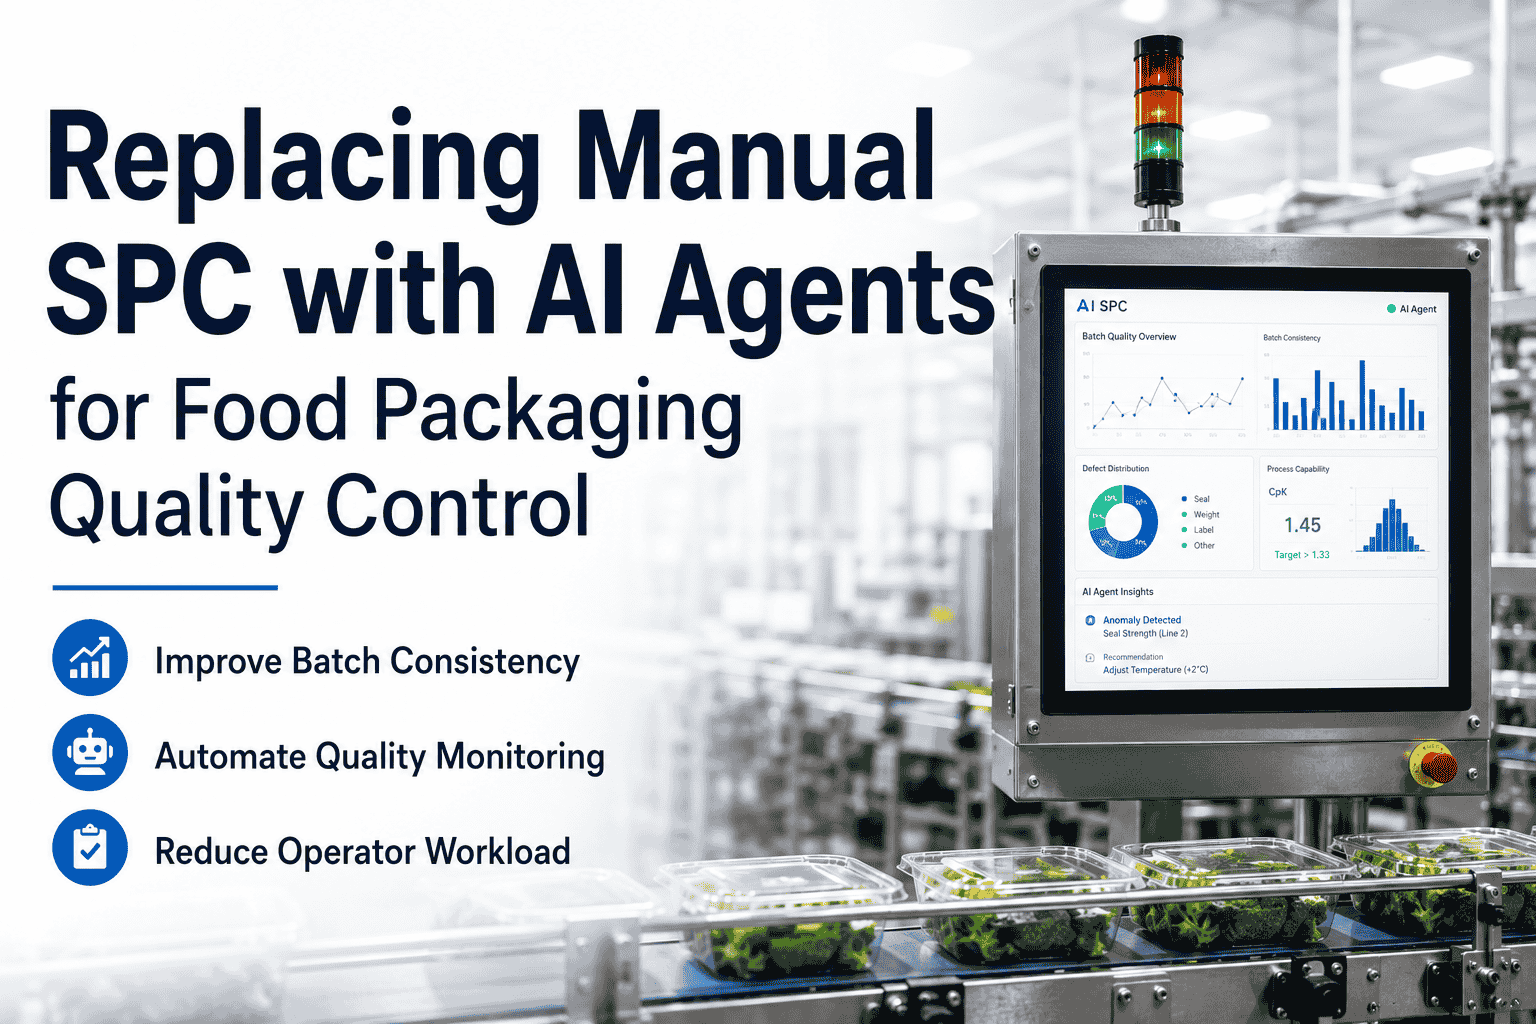
Replacing Manual SPC with AI Agents for Food & Beverage Manufacturing
By Riley Quinn on June 18, 2026
Your quality operators are spending 60 to 70% of every shift on tasks that generate zero process improvement — sampling at fixed intervals, manually plotting control charts, entering data into spreadsheets, and chasing down root causes after defects have already shipped. Book a demo to see how AI agents take over every one of those tasks, freeing your operators to do the work that actually moves yield, Cpk, and customer scorecard numbers in the right direction.
The Manual SPC Burden — Food & Beverage Manufacturing
Where Operator Productivity Goes When SPC Is Still Manual
A Typical Quality Operator Shift on Manual SPC
Sampling & manual data entry
38%
Plotting charts & reviewing limits
22%
Manual root cause investigation
18%
Audit prep & compliance paperwork
12%
Actual process improvement work
10%
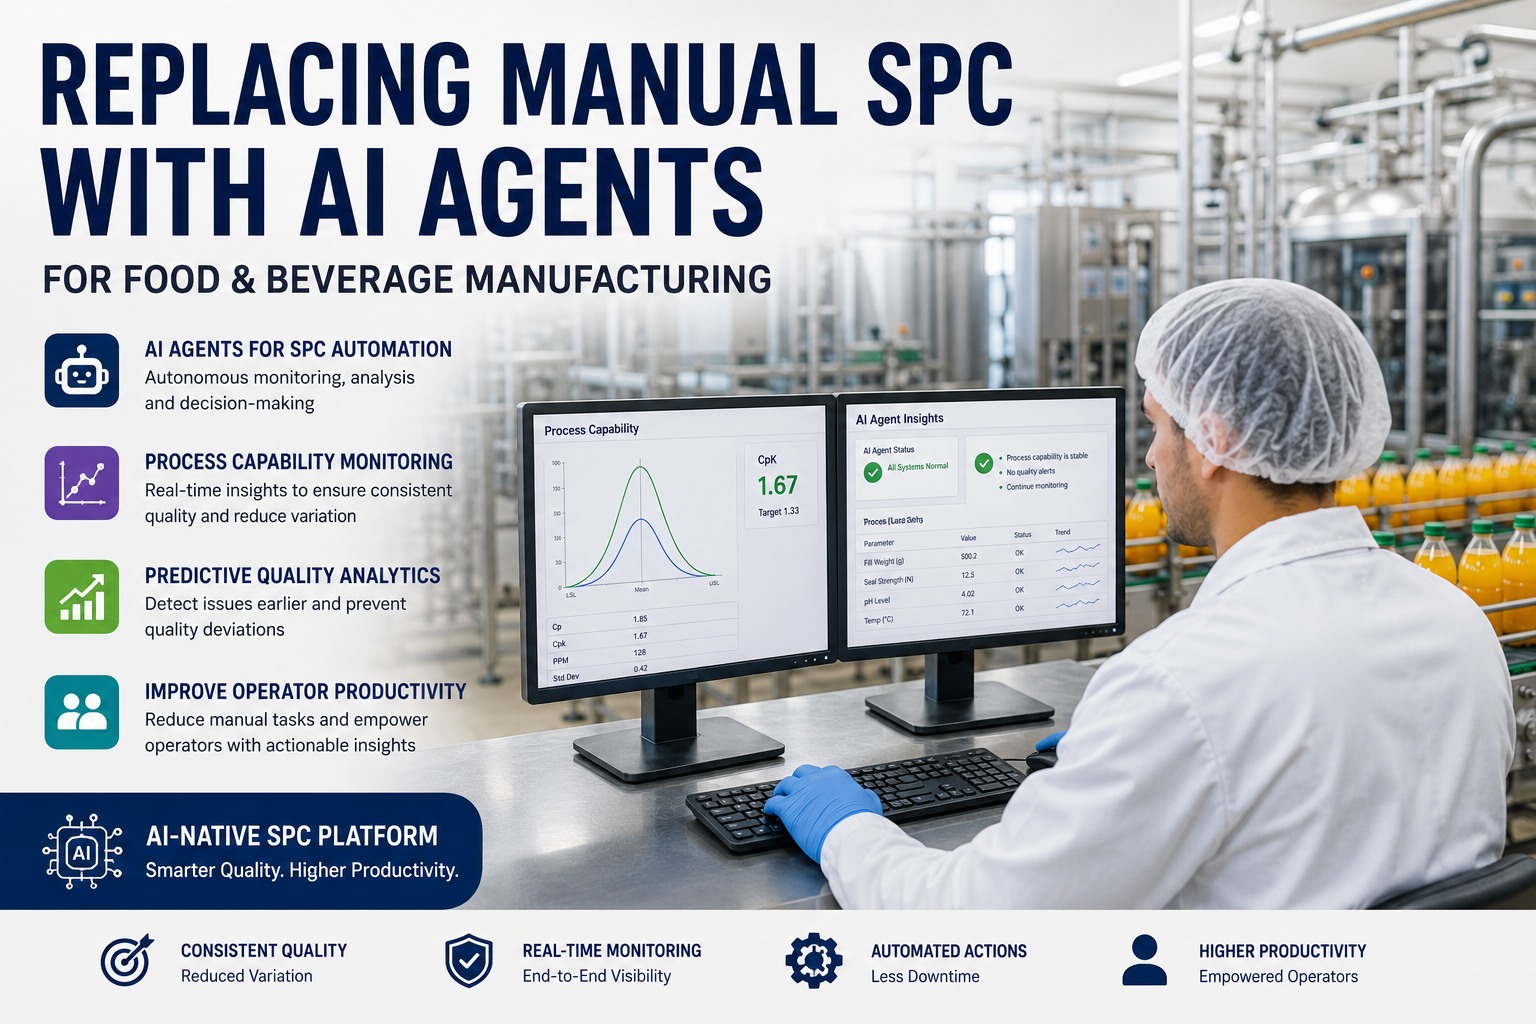
Only 10% of a quality operator's shift is spent on work that directly improves process capability. AI agents reclaim the other 90%.
What AI Agents Handle Automatically
Continuous 24/7 process monitoring — no fixed sample intervals
Real-time Cpk and capability recalculation on every data point
Drift alerts triggered before control limits are breached
Root cause pre-computed and evidence-backed in 3 to 5 minutes
Continuous batch records — always audit-ready, no manual prep
Multivariate correlation across all process variables simultaneously
The Real Cost of Manual SPC in F&B Manufacturing
Manual SPC was designed for a world where data collection was the hard part. In food and beverage manufacturing today, data is everywhere — sensors, historians, PLCs, LIMS — but most quality teams are still translating it into spreadsheets by hand, reviewing control charts shift by shift, and chasing root causes reactively. The cost is not just the labor hours. It is the process variation that goes undetected between sample intervals, the defects that reach packaging before an out-of-control signal fires, and the operator talent burned on transcription instead of improvement.
Blind Spots Between Samples
Manual SPC monitors at fixed intervals — every 30, 60, or 120 minutes. Process drift that starts and recovers between samples is invisible. By the time the next sample is taken, scrap has already been produced.
Operator Time Wasted on Transcription
75% of food and beverage manufacturers still collect quality data on paper or manually enter it into software. That is multiple hours per shift per operator spent on data entry that generates no process insight on its own.
Single-Variable Analysis Only
Manual SPC tracks one parameter at a time on a control chart. Food and beverage processes involve dozens of correlated variables — temperature, humidity, fill weight, pH, line speed, ingredient lot. Single-parameter charts miss multivariate drift signatures entirely.
Root Cause Takes 45 to 75 Minutes
When a manual SPC chart flags an out-of-control signal, the operator still has to investigate — pulling historian data, reviewing shift logs, checking equipment states. Average investigation: 45 to 75 minutes per event, often inconclusive.
Curious what this burden looks like for your specific lines? Book a demo and manual SPC burden assessment — we will quantify the operator hours and missed detection windows for your operation.
What AI Agents Actually Do That Manual SPC Cannot
AI agents in manufacturing are not a smarter version of rule-based SPC. They are a fundamentally different operating model. Where manual SPC monitors individual parameters against static thresholds, AI agents maintain a continuous causal hypothesis about your process — correlating equipment state, ingredient lot history, recipe parameters, environmental conditions, and operator actions simultaneously, around the clock, without sampling gaps.
01
Continuous Monitoring, Zero Gaps
Manual SPC
Samples every 30 to 120 minutes. Drift between samples is invisible. Operator must be present and alert to notice.
AI Agent
Every data point from every sensor, every second, every shift. No gaps, no fatigue, no missed transitions between products or lots.
02
Multivariate Process Capability Monitoring
Manual SPC
One parameter per control chart. Cpk calculated periodically by hand. Correlations between variables require separate analysis — rarely done in real time.
AI Agent
Cpk and Cp recalculated continuously across all parameters. Multivariate correlation across temperature, fill weight, pH, speed, and lot history — simultaneously.
03
Predictive Alerts Before Limits Breach
Manual SPC
Alert fires when a data point crosses the control limit. Damage is already in progress. Operator responds to an event that has already occurred.
AI Agent
Drift pattern recognized 4 to 24 hours before the limit is breached. Operator intervenes before scrap is produced, not after.
04
Autonomous Root Cause Pre-Computation
Manual SPC
Operator launches investigation after alert fires. Pulls historian data manually. Average time: 45 to 75 minutes. Conclusion often inconclusive.
AI Agent
Root cause pre-computed continuously. When an anomaly fires, the operator sees an evidence-backed explanation in 3 to 5 minutes — not a blank investigation queue.
Process Capability Monitoring: How AI Agents Change the Cpk Conversation
Process capability indices — Cp, Cpk, Pp, Ppk — are only meaningful if the process is in statistical control. Manual SPC makes capability analysis a periodic, backward-looking exercise. You calculate Cpk from last week's data, identify where you fell short, and hope next week's batch performs better. AI agents change this to a forward-looking, continuous model: Cpk is recalculated on every incoming data point, surfacing capability drift before it becomes a batch rejection or customer scorecard hit.
Process Capability Index (Cpk) — What Each Level Means in F&B
Cpk Value
Process Status
Manual SPC Response
AI Agent Response
Below 1.0
Producing defects — immediate action required
Alert fired after breach. Manual RCA begins. 45 to 75 min to diagnosis.
Drift detected hours earlier. RCA pre-computed. Operator intervenes before the breach.
1.0 to 1.33
Marginally capable — vulnerable to variation shifts
Visible on control chart only if operator is reviewing. Easy to miss between samples.
Meets spec. Operator moves on. Drift toward 1.33 often unnoticed until it is too late.
Capability trend monitored continuously. Early warning if Cpk drifts downward across shifts.
Above 1.67
Highly capable — Six Sigma-level target
Rarely achieved consistently without significant analyst bandwidth.
Target state AI agents continuously optimize toward — recipe adjustments, limit tightening, lot pre-screening.
Want to see live Cpk monitoring in action on a representative F&B line? Book a product demo and we will show you exactly how AI agents track and surface capability drift on your specific product types.
See AI Agents Replace Manual SPC on Your Lines
iFactory's AI SPC Migration Workshop shows you exactly what continuous process capability monitoring looks like for your F&B operation — multivariate drift detection, autonomous RCA, and real-time Cpk tracking — demonstrated on representative scenarios from your product types.
The Operator Productivity Shift: What Changes Day to Day
When AI agents handle continuous monitoring, Cpk recalculation, drift detection, and root cause pre-computation, your quality operators are not eliminated — they are elevated. The shift is from reactive data processors to proactive process engineers. Here is what a quality operator's day looks like before and after AI agents are deployed.
Operator Day Without AI Agents
Start of shift
Review overnight control charts manually. Check for any out-of-control signals that were missed.
Every 30 to 60 min
Pull samples, measure, hand-record or manually enter data into SPC software. Plot on chart. Check limits.
When alert fires
Begin manual RCA. Pull historian data. Check shift logs. Interview line staff. Average: 45 to 75 minutes. Often inconclusive.
Pre-audit period
Days of team effort compiling batch records, SPC charts, and deviation logs for auditor review.
End of shift
Complete shift reports. File paper records. Hand off open investigations to next shift with limited context.
Operator Day With AI Agents
Start of shift
AI agent shift summary ready: overnight anomalies ranked by severity, Cpk trends by line, pre-computed root causes for any events.
Continuous
AI monitors every sensor data point across all lines. Operator receives targeted alerts only when genuine intervention is needed.
When alert fires
Root cause already pre-computed with evidence. Operator reviews the finding, validates, and takes corrective action. Total: 3 to 5 minutes.
Audit readiness
Continuous batch records always current. Audit package generated on demand — minutes, not days of manual compilation.
Freed-up time
Process improvement projects, recipe optimization, Cpk improvement initiatives — work that moves the needle on quality KPIs.
What the Productivity Numbers Look Like After Deployment
The operator productivity gains from replacing manual SPC with AI agents are not marginal improvements — they represent a structural change in how quality work gets done on the plant floor. These outcomes are documented from F&B operations that completed full AI-native SPC deployments within 6 to 12 weeks.
90%
Reduction in manual data entry and charting time per shift
3 to 5 min
Root cause analysis — down from 45 to 75 minutes per event
5 to 10 pts
Yield improvement from predictive prevention of drift-driven scrap
40 to 65%
Cost of quality reduction across all production lines in year one
AI agents maintain a continuous causal hypothesis about plant operations, running multivariate correlations across equipment state, recipe parameters, ingredient lot history, environmental conditions, and operator actions. When an anomaly fires, the root cause is already pre-computed — the operator sees an evidence-backed explanation in 3 to 5 minutes rather than building one from scratch over the next hour. For food and beverage operations where every shift change, lot change, and product changeover introduces new variation, this is not an incremental improvement — it is a fundamentally different operating model.
— iFactory AI SPC Deployment Research, F&B Operations 2025 to 2026
75%
of F&B manufacturers still collect quality data manually or on paper
6 to 12 wk
Time to live on AI-native on-premise appliance
12 to 22%
OEE improvement typical within 12 months of deployment
Interested in what these numbers look like for your plant specifically? Book a demo and ROI sizing session — our F&B team will model expected productivity gains against your current manual SPC baseline.
Replace Manual SPC with AI Agents — Starting in 6 Weeks
iFactory's AI SPC Migration Workshop covers your current manual SPC burden assessment, a live demonstration of AI agent process capability monitoring on representative F&B scenarios, deployment roadmap, and a documented ROI model against your baseline. Quality, operations, IT, and finance — all in one half-day session.
What exactly does an AI agent do that manual SPC software cannot?
Manual SPC software automates chart rendering but still relies on operators to sample, enter data, review charts, and investigate alerts manually. AI agents go further: they monitor continuously from sensor data without fixed sample intervals, analyze multivariate correlations across all process parameters simultaneously, detect drift patterns before control limits are breached, and pre-compute root cause explanations autonomously. The operator's role shifts from data processor to decision-maker reviewing pre-built findings.
How does AI handle process capability monitoring differently from a traditional Cpk calculation?
Traditional Cpk is calculated periodically on a batch of historical samples — it is a backward-looking snapshot. AI-native process capability monitoring recalculates Cpk continuously on every incoming data point, tracks capability trends across shifts and lot changes, and surfaces early warnings when capability begins drifting downward before a breach occurs. A Cpk below 1.33 is flagged and root-caused before the batch is finished, not discovered in the post-production review.
Will AI agents replace our quality operators?
No — they eliminate the manual tasks that consume 70 to 90% of an operator's shift without generating process improvement. Sampling, data entry, chart plotting, routine alert triage, and audit prep are all handled by AI agents. The operator's time is redirected to genuine improvement work: acting on pre-computed root cause findings, driving Cpk improvement projects, and reviewing AI recommendations rather than building analyses from scratch. Most F&B plants deploying AI-native SPC retain the same team and redirect their capacity.
How long does it take to deploy AI agents for SPC in a food and beverage plant?
iFactory's on-premise NVIDIA appliance goes live in 6 to 12 weeks for a typical F&B operation. The AI models train on 12 to 24 months of historical production data from your existing historian and sensor infrastructure — no new sensor installation required in most cases. The first predictive alerts and capability monitoring dashboards are live within weeks, with model accuracy improving continuously as more operational data accumulates.
How do we get started evaluating AI agents for our SPC processes?
The best starting point is iFactory's AI SPC Migration Workshop — a half-day session covering your current manual SPC burden assessment, a live demonstration of AI agent process capability monitoring on representative F&B scenarios, deployment roadmap, and a documented ROI model against your specific scrap rate, RCA time, and audit burden baseline. Register your team for the AI SPC Migration Workshop here.