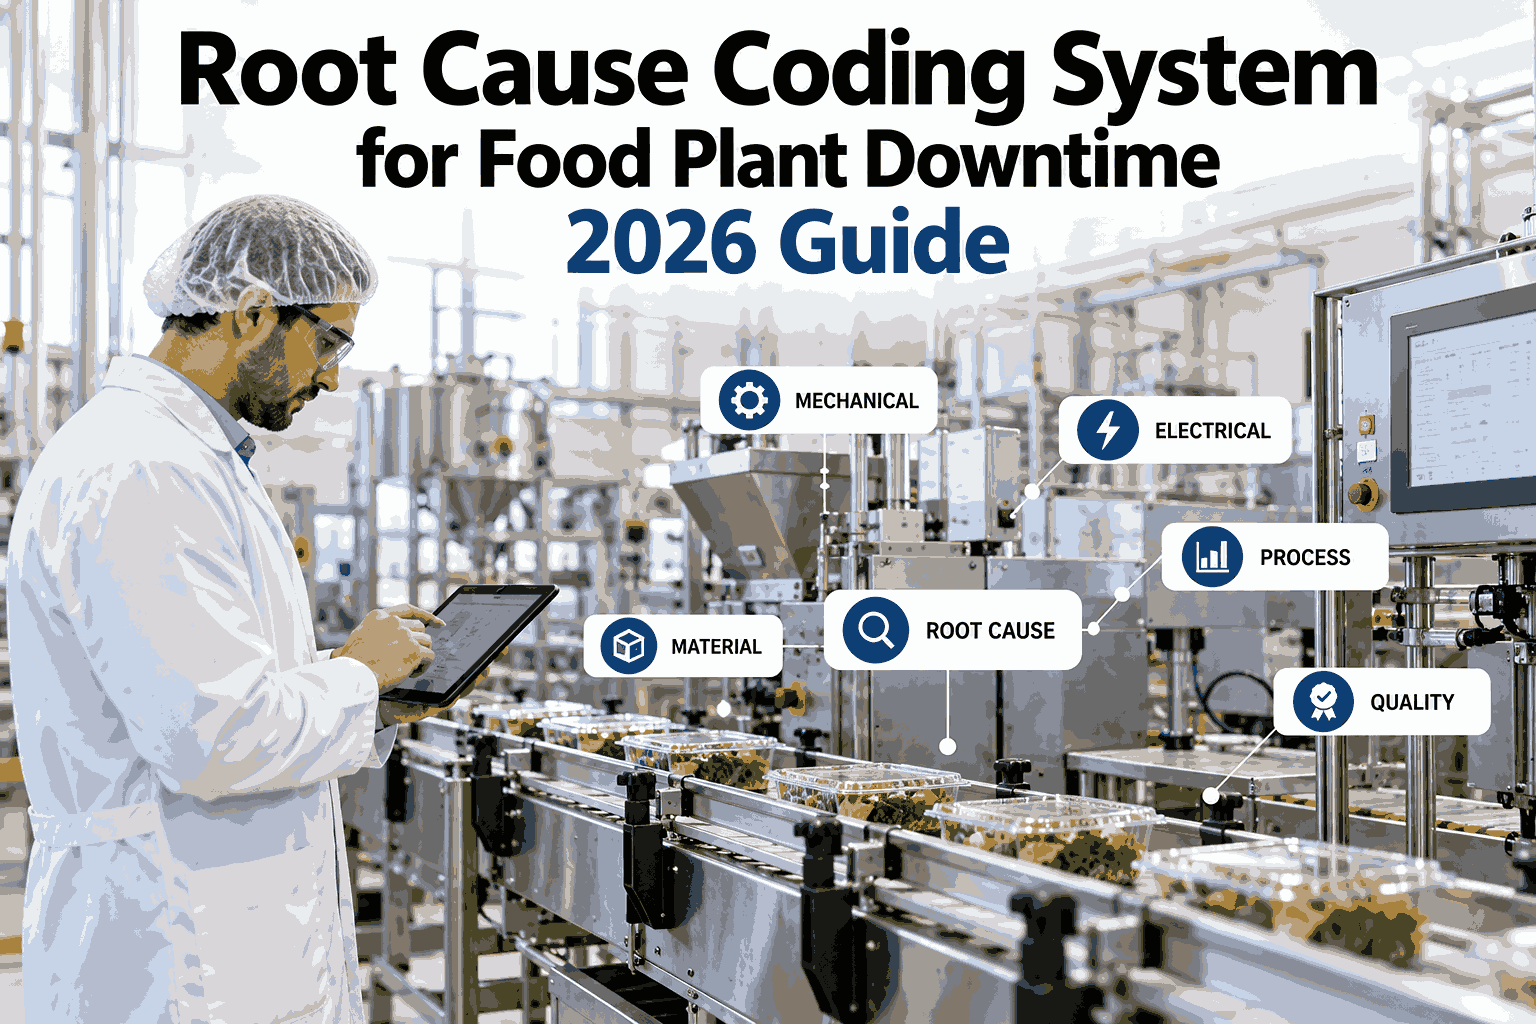
A food plant can log thousands of minutes of unplanned downtime and still learn almost nothing from it, because the reason field only says "jam," "sensor," or "other." A root cause coding system fixes that by recording two separate facts for every stop: what the operator saw, and why it truly happened. Once both facts sit in one consistent code, repeat failures stop hiding and every fix can be tracked until it holds. Teams building this discipline can review their current downtime codes with the iFactory AI support team before rolling the scheme out to every line.
One Code for What Stopped. One Code for Why. Fewer Repeat Failures.
iFactory AI helps food manufacturers turn every unplanned stop into a structured, trackable record, so the real cause is fixed once instead of being rediscovered every week.
code levels: symptom first, root cause second
symptom families operators can pick in seconds
root cause classes that every fix can be filed under
Why Most Downtime Logs Hide the Root Cause
Open almost any downtime log from a food plant and the pattern repeats. The operator picks the nearest reason from a short list, adds a few words, and gets the line running again. That is the right priority in the moment, but it means the record captures a symptom rather than a cause.
A Typical Uncoded Entry
A Two-Level Coded Entry
Symptom-only logs also collapse very different events into one bucket. A jam caused by a worn guide and a jam caused by inconsistent portion size look identical in the report, yet they need completely different fixes.
Where Uncoded Downtime Tends to Collapse (Sample Data)
When the biggest bucket is the one that explains nothing, no amount of reporting will point maintenance at the right problem. The fix starts at the moment of entry, not in the monthly review.
The Two-Level Architecture in One Picture
The scheme works because it splits one hard question into two easy ones. The operator answers the first while standing at the line. A technician or supervisor answers the second once the facts are checked.
Line Stops
Start time and duration are captured automatically from the equipment signal.
Level 1 Symptom
The operator picks one of eight families, in seconds, while restarting.
Verification
A technician checks the evidence before anyone names a cause.
Level 2 Root Cause
Maintenance or quality selects the class within a set review window.
Action Tag
A fix type, owner, and due date close the loop and start tracking.
Notice that the operator never has to guess at a cause under pressure. That one design choice protects both the speed of the restart and the quality of the data.
Level 1 Asks: What Did We See?
Level 2 Asks: Why Did It Happen?
Level 1: Eight Symptom Families Operators Can Learn in a Day
A symptom list only works if it fits on a single screen and covers nearly every stop a food line produces. Eight families is a practical ceiling. Beyond that, operators start choosing by habit instead of by accuracy.
Product Jam
Blockage at an infeed, chute, or transfer point.
Starved or Blocked
The line waits for product or cannot discharge it.
Detector Trip
Metal detector, vision, or checkweigher stops the line.
Mechanical Breakdown
Seized, broken, or worn equipment prevents running.
Control Fault
Drive trip, PLC alarm, or communication loss.
Utility Loss
Steam, compressed air, water, or refrigeration supply drops.
Quality Hold
Temperature, weight, seal, or label check halts production.
Changeover Overrun
Sanitation or changeover runs past its planned time.
Each family should have one clear definition printed on the operator screen. If two people can reasonably pick different families for the same event, the definitions need tightening before rollout.
Level 2: Six Root Cause Classes Every Fix Can Be Filed Under
Root cause classes answer a different question from symptoms. They describe the underlying condition that, once corrected, stops the symptom from returning. Six classes cover most food plant failures without becoming unmanageable.
Equipment Condition
Wear, lubrication, misalignment, fit, or design limits of the machine itself.
Method and Procedure
Missing, unclear, or unfollowed setup, start-up, or sanitation steps.
Material and Ingredient
Variation in product size, temperature, moisture, film, or packaging.
Maintenance Practice
Missed or deferred preventive tasks, wrong spares, or weak inspection routes.
People and Skill
Training gaps, shift handover losses, or unclear ownership.
Environment and Utilities
Washdown ingress, humidity, temperature swings, or unstable supply.
The table below shows how a symptom usually points toward a short list of likely classes. It narrows the search, but the technician still confirms the cause with evidence.
| Level 1 Symptom | Likely Level 2 Classes | First Verification Step |
|---|---|---|
| JAM, product jam | R1 equipment, R3 material | Inspect guide wear and check product size spread |
| TRP, detector trip | R6 environment, R1 equipment | Retest with certified test pieces before blaming product |
| BRK, breakdown | R4 maintenance, R1 equipment | Review PM history and component age |
| CTL, control fault | R6 environment, R4 maintenance | Inspect enclosure seals and read the fault log |
| UTL, utility loss | R6 environment, R4 maintenance | Trend supply pressure or temperature before the event |
| OVR, overrun | R2 method, R5 people | Compare actual step times against the standard |
See Two-Level Coding Running on Your Own Lines
Book a 30-minute session and the iFactory AI team will map your current downtime reasons into a symptom and root cause scheme built for your products and equipment.
Anatomy of a Good Code
A code should be readable at a glance and sortable in a report. Three short segments carry everything an analyst needs: where it happened, what was seen, and why it happened.
Four naming rules keep the scheme clean as more lines and shifts start using it. Breaking them is the fastest way to bring the old "other" bucket back.
One Event, One Pair
Every stop gets exactly one symptom and one root cause. Combined reasons hide the main driver.
No Bare "Other"
If a code is not listed, the entry needs a short note and a review, not a silent dump bucket.
Stable Meanings
Once a code is live, its definition does not change, so trends stay comparable over months.
Named Owners
Each root cause class has a team that reviews it, so nothing sits unassigned.
Symptom Versus Root Cause on a Real Food Line
The hardest habit to break is naming a cause that is really just a louder symptom. These food plant examples show how one logged event can hide several different realities.
| What the Operator Logged | What May Really Be Behind It | Question That Separates Them |
|---|---|---|
| Sealer stopped, film wrinkling | Film tension drift, or product trapped in the seal area | Does the fault follow a specific film roll or fill? |
| Metal detector reject stop | Real contaminant, product effect, or detector drift | Does the rejected pack actually contain metal on inspection? |
| Filler weight hold | Product temperature or viscosity variation | Did batch temperature change before the weight drifted? |
| Freezer high-temperature alarm | Defrost timing, evaporator icing, or door left open | Does the alarm time match the defrost schedule? |
| Conveyor jam at infeed | Portion size variation from an upstream cutter | Did the jam begin after an upstream changeover? |
| CIP cycle overran | Chemical concentration or heat missing its setpoint | Which CIP step failed to reach its target? |
Each verification question is cheap to answer and turns an opinion into evidence. That is what separates a coded root cause from a guess with a label attached.
Closing the Loop With Corrective Action Tags
A root cause code only creates value when it triggers a fix. Tagging every corrective action with a fix type connects the downtime record to the work that prevents the next stop.
Restore the part or setting to its intended condition.
Change the equipment so the failure cannot recur the same way.
Write or correct the standard work for setup or sanitation.
Close a skill gap shown by repeated people-related codes.
Add or adjust a preventive task or inspection frequency.
Raise a spec or quality issue with an ingredient or packaging source.
Once actions are tagged, a Pareto of root cause classes shows where fixes will pay back first. The chart below uses sample data to show the shape of a typical result.
Share of Repeat Downtime by Root Cause Class (Sample Data)
A fix is not finished when the work order closes. It is finished when the code stops appearing, which is why every action needs a verification window.
Day 30 Watch
Check whether the same line and code have returned since the fix.
Day 60 Review
Compare minutes lost for that code against the prior period.
Day 90 Close
Close the action only if the pattern has stayed away.
A 30-60-90 Day Rollout That Operators Will Actually Follow
Coding schemes fail when they are launched everywhere at once. A staged rollout lets one line prove the value and fix the wording before the rest of the plant adopts it.
Design and Pilot
Draft the eight symptom families and six classes. Test them on one line and one shift.
Refine and Expand
Rewrite unclear definitions, remove unused codes, and extend to more lines.
Review and Embed
Start weekly root cause reviews and link every action to a tracked owner.
The pilot line should be one with frequent, visible stops. Early wins on a busy line build the credibility that makes later shifts willing to follow the same discipline.
Measuring the Health of Your Coding Discipline
A coding system can quietly decay as people rush or skip steps. A short scorecard keeps the discipline visible. The targets below are suggested starting points, and each plant should adjust them to its own pace.
Suggested Scorecard Targets
When the "other" share creeps up, it usually means the symptom list is missing a real event or the definitions are unclear. Treat it as a design signal, not an operator failing.
Where iFactory AI Fits
Running this scheme on paper or spreadsheets works for one line and breaks down across a plant. iFactory AI keeps the codes, evidence, and actions in one place, so the discipline survives shift changes and growth.
Fast Operator Entry
Level 1 symptoms are one-tap choices tied to the stop event, so the restart is never slowed down.
Guided Root Cause Review
Technicians see the symptom, line history, and verification questions before choosing a Level 2 class.
Recurring Cause Detection
The same code returning on the same asset is flagged, so repeat failures are visible without manual digging.
Linked Corrective Actions
Every action carries a fix type, owner, due date, and verification window until the pattern stays gone.
Plants that want a guided start can see a live walkthrough of coded downtime review using their own line layout.
Delivered Turnkey, Live in 6 to 12 Weeks
Frequently Asked Questions
Why use two code levels instead of one detailed list?
One long list forces operators to guess a cause under pressure, which lowers accuracy. Two levels separate what was seen from why it happened, so each person answers only what they can know. Our support team can help you size the lists for your lines.
Who should assign the Level 2 root cause?
A technician, maintenance planner, or quality lead should choose it after checking evidence. Operators stay focused on the symptom and restart. Assigning Level 2 within a set review window, such as 72 hours for major stops, keeps details fresh.
How many codes are too many?
Eight symptom families and six root cause classes cover most food plants. If operators hesitate or pick by habit, the list is too long. Add sub-codes under a class only after the main scheme has run stably for a few months.
Can this scheme support food safety and CAPA work?
Yes. Quality holds, detector trips, and sanitation overruns each get their own symptom family, and corrective actions carry owners and dates. That gives audits a clear trail from event to fix. Book a demo to see the linked action trail in practice.
What if the root cause is still unknown after review?
Log it as under investigation with a named owner and a review date, rather than forcing a weak code. If the same symptom repeats on the same asset, the system treats it as a priority and prompts a deeper analysis.
Turn Every Unplanned Stop Into a Permanent Fix
iFactory AI captures the symptom, confirms the root cause, and tracks the corrective action until the failure stays gone. Book a walkthrough to see it on your own downtime data.